Figure 2.
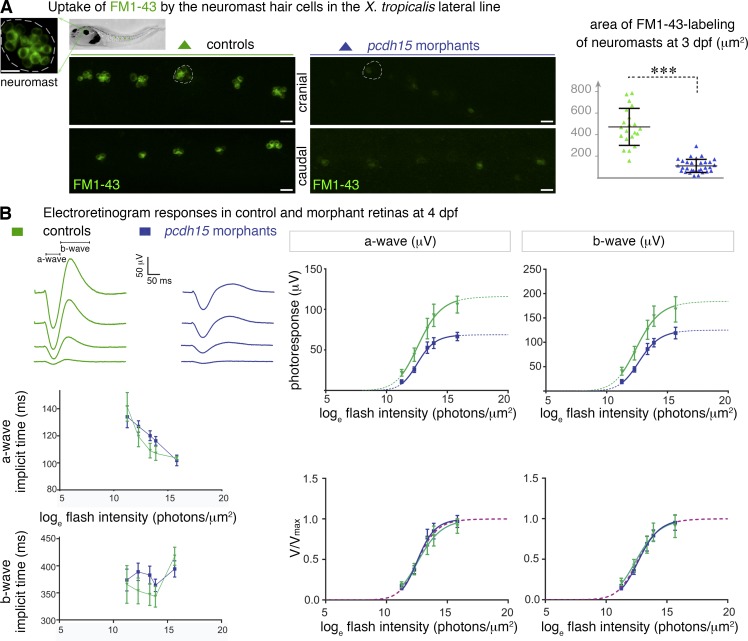
Pcdh15 morphant larvae have altered mechanoelectrical transduction channels and photosensory deficits. (A) Uptake of FM1–43 dye by the hair cells of cranial and caudal neuromasts (high magnification of a neuromast, with 6–12 sensory hair cells shown). Dye uptake in neuromasts (some are outlined) is much weaker in 3-dpf pcdh15 morphants than it is in controls: 120.6 ± 15.5 µm2 in morphants (mean ± SEM; n = 33), versus 471.2 ± 37.5 µm2 in controls (n = 21; unpaired t test, ***, P < 0.0001). (B, top left) Representative electroretinogram traces (flash intensity increasing from bottom to top). (bottom left) The time-to-peak values obtained for the a- and b-waves (implicit times) did not differ significantly between controls and morphants. (right) Photoresponse curves (V, μV), plotted as a function of flash intensity and fitted with the Naka–Rushton function, in morphants and controls. The responses show a significant attenuation in morphants (comparison of fits by the least-squares method: P < 0.0001 for both waves), whereas after normalization by the maximum value Vmax, they do not differ significantly, giving similar values of I0.5 (P > 0.5 for both waves; bottom right panel; n = 7 controls, 13 morphants). Bars, 20 µm.

