Figure 6.
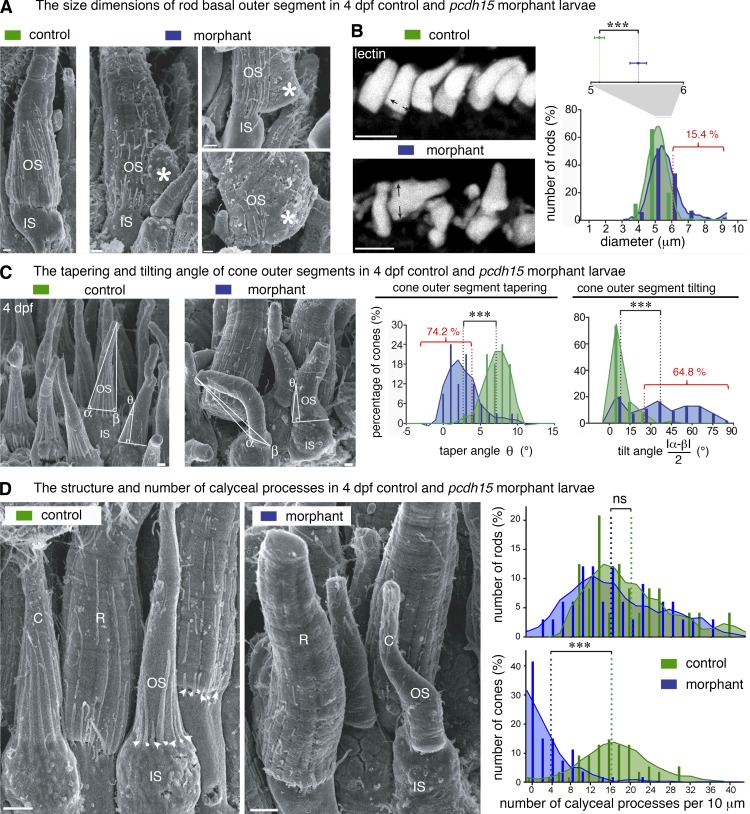
Pcdh15 knockdown in X. tropicalis causes distinct morphological alterations to the rod and cone outer segments and the associated calyceal processes (scanning electron microscopy analyses). (A) In scanning electron micrographs, rod outer segments (OS) of 4-dpf morphants often display basal swelling and bulges, observed in 24 of 126 (19%) of morphant rods (n = 3 retinas, 95% CI, 17.3–19.3%). Occasionally, the base of the OS (asterisks) extended well beyond the edge of the inner segment (IS). Calyceal processes (CPs) are not detected adjacent to the basal outgrowths (asterisks). (B) In control retinas (top left), the basal diameters of the rod OS stained with WGA lectin (white) have a distribution close to normal (green bar graph and curve), centered on 5.1 ± 0.05 µm (mean ± SEM, n = 99; D’Agostino–Pearson test, P = 0.8; skewness: 0.15). In morphant retinas, the diameters have a non-normal distribution (blue bar graph and curve), centered on 5.5 ± 0.1 µm with a large positive skew (n = 104; D’Agostino–Pearson test, P < 0.0001; skewness: 1.16). In morphant retinas, the basal diameter of rods was significantly larger than in controls (unpaired t test, ***, P < 0.001), greater than two SDs from the control mean in 16 of 104 (15.4%) morphant rods. (C) At 4 dpf, control cone photoreceptors possess a slender OS coaxial with the IS and are characterized by a pronounced conical taper; both features are altered in the morphant cones. The OS tilt and taper were estimated on scanning electron micrographs by measuring the basal angles α and β and the taper angle θ at 5 µm from the IS–OS interface. The frequency histograms for tilt and taper angles show a narrow distribution of tilt angles centered on 5.8° (median value, n = 68) in control larvae, whereas in the morphants, the distribution is wider and flatter (median value, 36.5°; n = 54), reflecting considerable variability in tilt (K-S test, ***, P < 0.0001; bin width, 10°); 35 of 54 (64.8%) of the morphant cone OS had a tilt more than 2 SD greater than the control mean. The taper angle of the morphant cone OS was significantly smaller than that of the controls (2.7 ± 0.4°, n = 31; and 7.1 ± 0.3°, n = 32, respectively [mean ± SEM]; bin, 3°; K-S test, ***, P < 0.0001); 23 of 31 (74.2%) of morphant cone OS had a taper more than 2 SD less than the control mean. (D) We determined the number of calyceal processes (CPs) by counting them at their point of emergence (arrowheads) and plotted that number as linear density (number of CPs per 10 µm of IS–OS interface) for both rod (R) and cone (C) photoreceptors. Frequency distributions (bin width, 2 CPs per 10 µm) are significantly lower in morphant cones, but not in the rods. Mean densities in rods (in CPs per 10 µm): controls, 19.4 ± 1.6 (mean ± SEM, n = 24); morphants, 16.5 ± 1.5 (n = 33); K-S test, P = 0.27. Mean densities in cones: controls, 16.7 ± 0.8 (n = 53); morphants 3.7 ± 0.6 (n = 53); P < 0.0001. Bars: (A and C) 1 µm; (B) 10 µm; (D) 5 µm.

