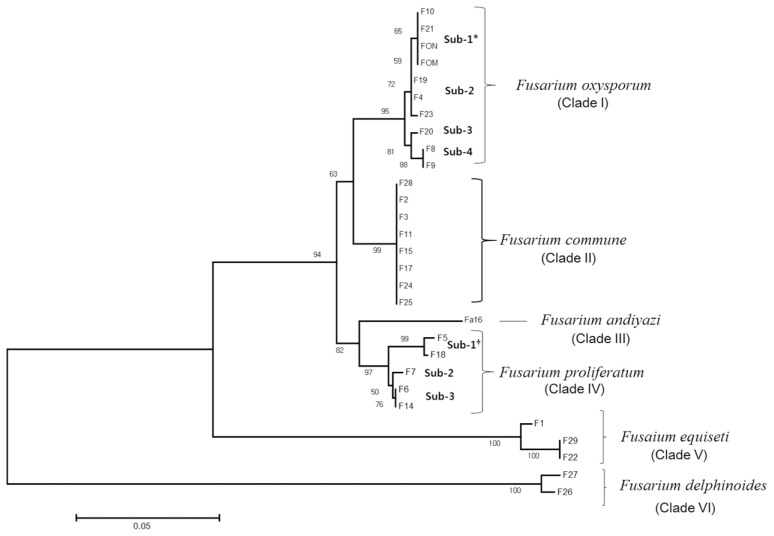
Fig. 2.
Phylogenetic analysis using the maximum likelihood method on the basis of elongation factor-1 alpha gene sequencing. The numbers beside branches represent the percentage of congruent cluster in 1,000 bootstrap trials. The bar indicates 5% sequence dissimilarity. An asterisk (*) indicates subclades of Fusarium oxysporum. A dagger (†) indicates subclades of Fusarium proliferatum.

