

Introduction
Pain interference refers to pain limiting physical, mental and social activities. It is a key component in the evaluation of pain in clinical trials and patients’ total health experience. The National Institutes of Health (NIH) Patient-Reported Outcomes Measurement Information System (PROMIS®) project developed an item bank to measure pain interference.1
Latinos accounted for more than half of the total U.S. population growth between the years 2000 and 2010. The number of Latinos increased from representing 12% of the total population in 2000, to 16% in 2010 and 17% in 2014.2,3 Even though the number of Latinos who speak English proficiently is growing, a large number still prefers to use the Spanish language; about 73% of Latinos ages 5 and older speak Spanish at home.4 About one-third of Latinos in the U.S. speak English “less than very well” or “not at all”.5 Within this subgroup, most of them have lower levels of education and are foreign-born.5
One of the goals of PROMIS® is to improve precision and enhance the comparability of health outcomes measures among different groups.6 Comparison between different groups assumes items mean the same to people from the different groups. If subjects respond differently depending on an external variable, language in this case, group comparisons are problematic. The use of this item bank is only valid for measurement across languages, if those subjects with the same level of pain interference respond equally to these items. The purpose of this study is to compare responses to the Spanish and English language versions of the PROMIS® pain interference item bank.
Methods
PROMIS® Pain Interference (PI) Item Bank
The PROMIS® PI item bank consists of 41 items. All items were administered with a five-point response scale where 1 indicated the least and 5 indicated the most pain interference.1 The PI items can be seen in Appendix A.
Spanish Translation of PI Items
The PROMIS® PI items were translated into Spanish using a universal approach for translations and cultural adaptation of instruments: 2 initial forward translations from English to Spanish, 1 reconciled version, 1 back translation, comparison and reconciliation of original English version with back-translation and review by 3 bilingual experts from different Spanish-speaking countries.7,8 Five cognitive interviews with native-Spanish speakers followed to evaluate the comprehension of the items.
Spanish Language Data
Toluna, an independent internet survey provider, maintains a panel of potential survey respondents that are characterized by several demographic factors including preferred language.9 Toluna recruited 527 Spanishspeaking respondents who reported pain in the last 7 days for this study. Study participants completed by internet the PROMIS® PI item bank and the Short Acculturation Scale for Hispanics (SASH).10 The rating scale of the SASH ranges from 1 (“Only Spanish”) to 5 (“Only English”) and an average score <3.0 reflects low acculturation.
Psychometric Analyses
The analysis plan for the Spanish-language PI data followed the same approach used for the English language PROMIS® item banks.11 Descriptive statistics included item category frequencies, means, standard deviations and ranges. Scale statistics included inter-item correlations, item-rest scale correlations and internal consistency reliability (coefficient alpha).
Monotonicity (the probability of selecting a response option that represents more of the trait being measured increases as respondent’s trait level increases), scale unidimensionality (only one construct is represented by the items in a scale) and item local independence (items are uncorrelated after controlling for the underlining trait) are the item response theory (IRT) assumptions we evaluated for the PROMIS pain interference bank.12 Graphing item mean scores by total scores (minus the item score) was used to assess monotonicity. Scale dimensionality was evaluated by parallel analysis, scree plot and by assessing the fit of a one-factor categorical confirmatory factor analysis model to the data using Mplus.13 Model fit was assessed by the Comparative Fit Index (CFI) and Tucker-Lewis Index (TLI), as well as the root mean square error of approximation (RMSEA). Good model fit is defined by the following cutoffs: CFI>0.95, TLI >0.95, and RMSEA <0.06.14 Residual item correlations (<0.20) after the one-factor model was fit were examined to assess local independence.
IRT item parameters were estimated with Samejima’s Graded Response Model (GRM) as implemented in Multilog.15 Fit of items to the GRM was assessed by the IRTFIT SAS macro.
16,17The GRM yields one slope parameter and (n - 1) threshold parameters for polytomous items with n response categories. The slope parameter provides information about item discrimination between contiguous categories. Items with higher slope values are better able to discriminate among respondents with similar trait levels. The threshold parameters represent the points along the latent trait at which a respondent has a 50% chance of responding in a particular category or higher. The threshold values provide an indication of where on the latent trait item response categories are likely to be endorsed by respondents.
Differential item functioning (DIF) occurs when the probability of endorsing a particular item response category varies as a function of an external variable while controlling for the underlying trait level.12 More specifically, DIF is present when the probability of selecting a particular response option varies by language group while controlling for the underlying level of pain interference.18,19
The PROMIS® Wave-1 English language item parameters have been described in detail elsewhere.11,20 Respondents who suffer from pain interference should be more likely to select responses that indicate pain interference than those who do not suffer from pain interference. An item shows DIF if respondents from different language groups but with the same level of pain interference have unequal probabilities of selecting a specific response option. DIF was assessed by comparing the Spanish-language (n=527) item parameters with the PROMIS® Wave-1 English-language (n=716) item parameters.21
Language DIF was evaluated using software (LORDIF version 0.3–3; published 3/3/16) that implements ordinal logistic regression (OLR) with IRT-based trait scores estimated from DIF-free “anchor” items (after iterative purification) as the conditioning variable.22,23 First, a model was tested in which all parameters are constrained to be equal across groups, as compared to a model with one parameter freed to be calculated for each group. Once the anchor items were identified, a set of three OLR models were estimated for each item and compared to identify overall, uniform and non-uniform DIF. Model 1 includes the intercept plus an estimate of the trait; Model 2 is Model 1 plus a group (English vs. Spanish) variable; and Model 3 is Model 2 plus the interaction of trait and the group variable. Uniform DIF occurs when DIF is in the same direction across the entire pain continuum (response curves for both groups do not cross); while non-uniform DIF occurs when the probability of endorsing an item is higher for one group at lower levels of pain, and higher for the other group at higher levels of pain (response curves for both groups cross at a certain point along the continuum). Overall DIF can be evaluated comparing OLR Models 1 and 3, uniform DIF can be evaluated comparing Models 1 and 2, and non-uniform DIF by comparing Models 2 and 3.20,22 We used a pseudo R2 value of 0.02 or more as the DIF threshold.20,22
We then examined the magnitude of DIF for English versus Spanish language using test characteristic curves separately for all pain interference items and for the items identifies as having DIF. LORDIF provides several graphics to evaluate the impact of DIF including item characteristic curves by language group, item response functions by language group and the absolute difference between the item characteristic curves for each language group weighted by the score distribution for the focal group (Spanish).
Results
Sample Characteristics
The Spanish-speaking sample included 527 adult Hispanic adults (63% female). The mean age of the sample was 36 years (SD=10.5 years) with an age range of 18–74 years. Nine percent of the sample reported speaking Spanish only, 53% reported speaking Spanish better than English, 37% reported speaking Spanish and English equally well and <1% (n=4) reported speaking English better than Spanish. Twenty-three percent reported speaking Spanish only at home, 58% reported speaking more Spanish than English at home, 17% reported speaking both equally, 1% reported speaking more English than Spanish at home and <1% (n=1) reported speaking only English at home. The mean SASH score was 2.1 (SD=0.49) with the minimum observed score of 1 and maximum score of 2.75. Twelve percent of the sample had less than completed high school, 20% were high school graduates, 34% had some college, 34% had a college degree or more. See Table 1.
Table 1.
Sociodemographic and Clinical Characteristics of Spanish (n=527) and English (n=716) Pain Interference Sample
| Spanish | English | Comparison | |
|---|---|---|---|
| Age: (mean/SD/range) | 36.5 (10.5) 18–74 | 51.7 (18.8) 18–88 | t(1159)=18.03, p<.0001 |
| SASH score1: (mean/SD/range) | 2.1 (0.49) 1–2.75 | — | — |
| Age categories: (n/%) | |||
| >=50 | 64 (12) | 381 (53) | p<.0001 |
| <50 | 463 (88) | 332 (47) | |
| Gender: (n/%) | |||
| Male | 193 (37) | 324 (45) | p< .001 |
| Female | 334 (63) | 392 (55) | |
| Race/Ethnicity: (n/%) | |||
| Hispanic | 527 (100) | 65 (9) | – |
| Non-Hispanic White | 447 (85) | 574 (89) | p<.05 |
| Non-Hispanic Black or African American | 52 (10) | 59 (9) | n.s. |
| Non-Hispanic other race | 48 (9) | 13 (2) | p<.0001 |
| Education: (n/%) | |||
| Less than High School Grad/GED | 65 (12) | 14 (18) | Chi(3)=82.61, p< .001 |
| HS graduate/GED | 107 (20) | 122 (15) | |
| Some college | 177 (34) | 266 (60) | |
| College degree or higher | 178 (34) | 396 (50) | |
| Comorbidities – ever told you have: (n/%) | |||
| High blood pressure | 120 (23) | 261 (39) | p<.0001 |
| Chest pain (angina) | 44 (8) | 39 (6) | p<.10 |
| Hardening of the arteries | 3 (<1) | 27 (4) | p<.0001 |
| Heart failure or congestive heart failure | 11 (2) | 18 (3) | n.s. |
| Heart attack (myocardial infarction) | 9 (2) | 27 (4) | p< .05 |
| Stroke or transient ischemic attack (TIA) | 6 (1) | 20 (3) | p<.05 |
| Liver disease, hepatitis, or cirrhosis | 17 (3) | 18 (3) | n.s. |
| Kidney disease | 26 (5) | 13 (2) | p<.01 |
| Arthritis or rheumatism | 71 (13) | 177 (26) | p<.0001 |
| Asthma | 85 (16) | 106 (16) | n.s. |
| Chronic lung disease (COPD), chronic bronchitis or emphysema | 21 (4) | 31 (5) | n.s. |
| Migraines or severe headaches | 150 (28) | 106 (16) | p<.0001 |
| Diabetes or high blood sugar or sugar in urine | 64 (12) | 66 (10) | n.s. |
| Cancer other than non-melanoma skin cancer | 16 (3) | 61 (9) | p<.0001 |
| Depression | 116 (22) | 156 (23) | n.s. |
| Anxiety | 94 (18) | 106 (16) | n.s. |
| Alcohol or drug problem | 15 (3) | 18 (3) | n.s. |
| Sleep disorder | 66 (13) | 68 (10) | n.s. |
| HIV or AIDS | 9 (2) | 5 (1) | n.s. |
| Spinal cord injury | 9 (1) | 17 (3) | n.s. |
| Multiple sclerosis | 5 (1) | 5 (1) | n.s. |
| Other condition | 139 (26) | 165 (24) | n.s. |
SASH Score: Short Acculturation Scale for Hispanics (SASH); the rating scale ranges from 1 (“Only Spanish”) to 5 (“Only English”) and an average score <3.0 reflects low acculturation.
Descriptive Statistics
As noted above, the PROMIS® PI item bank includes 41 items each with 5 response categories where 1 indicates the least pain (not at all or never) and 5 indicates the most pain (very much, always, or every few hours). The item means, standard deviations and category endorsement frequencies are presented in Table 2. The overall raw mean score was 102; the minimum observed simple-summated (raw) scale score was 41; and maximum observed raw score was 203. Category 5 (Very Much) had the lowest average endorsement rate of 6% across all items. The minimum category endorsement rate was 2% (Category 5 – Very Much) and the maximum category endorsement rate was 45% (Category 1 – Not at All). No items had sparse data based on the sparse data criteria of fewer than 5 responses.
Table 2.
Summary Statistics for Spanish Pain Interference Items (n=527)
| Item | Mean | SD | Not at All (1) | A Little Bit (2) | Somewhat (3) | Quite A Lot (4) | Very Much (5) | Item-Rest Correlation | Alpha w/Item Deletion |
|---|---|---|---|---|---|---|---|---|---|
| PI1 | 2.23 | 1.16 | 36% | 25% | 22% | 14% | 3% | 0.74 | 0.99 |
| PI3 | 2.64 | 1.17 | 20% | 28% | 27% | 20% | 6% | 0.84 | 0.99 |
| PI5 | 2.67 | 1.19 | 20% | 26% | 28% | 19% | 7% | 0.85 | 0.99 |
| PI6 | 2.48 | 1.20 | 27% | 25% | 27% | 16% | 6% | 0.83 | 0.99 |
| PI8 | 2.62 | 1.17 | 20% | 29% | 27% | 18% | 6% | 0.77 | 0.99 |
| PI9 | 2.64 | 1.08 | 15% | 32% | 31% | 17% | 5% | 0.85 | 0.99 |
| PI10 | 2.72 | 1.16 | 17% | 29% | 28% | 20% | 7% | 0.83 | 0.99 |
| PI11 | 2.55 | 1.16 | 21% | 31% | 25% | 17% | 6% | 0.81 | 0.99 |
| PI12 | 2.70 | 1.16 | 17% | 29% | 28% | 19% | 7% | 0.85 | 0.99 |
| PI13 | 2.47 | 1.19 | 26% | 27% | 25% | 16% | 5% | 0.85 | 0.99 |
| PI14 | 2.57 | 1.19 | 23% | 26% | 28% | 17% | 6% | 0.86 | 0.99 |
| PI16 | 2.60 | 1.19 | 23% | 25% | 30% | 16% | 7% | 0.81 | 0.99 |
| PI17 | 2.38 | 1.19 | 30% | 25% | 26% | 14% | 5% | 0.85 | 0.99 |
| PI18 | 2.64 | 1.18 | 19% | 30% | 28% | 16% | 8% | 0.86 | 0.99 |
| PI19 | 2.70 | 1.20 | 18% | 30% | 25% | 19% | 8% | 0.76 | 0.99 |
| PI20 | 2.68 | 1.20 | 19% | 29% | 24% | 21% | 7% | 0.86 | 0.99 |
| PI22 | 2.62 | 1.18 | 20% | 30% | 27% | 17% | 7% | 0.87 | 0.99 |
| PI24 | 2.63 | 1.12 | 19% | 26% | 32% | 18% | 5% | 0.83 | 0.99 |
| PI26 | 2.39 | 1.16 | 28% | 28% | 26% | 14% | 5% | 0.86 | 0.99 |
| PI29 | 2.40 | 1.15 | 28% | 27% | 27% | 14% | 4% | 0.84 | 0.99 |
| PI31 | 2.49 | 1.20 | 25% | 29% | 24% | 16% | 6% | 0.88 | 0.99 |
| PI32 | 2.67 | 1.14 | 20% | 23% | 33% | 19% | 5% | 0.82 | 0.99 |
| PI34 | 2.57 | 1.15 | 20% | 30% | 27% | 17% | 6% | 0.88 | 0.99 |
| PI35 | 2.42 | 1.28 | 32% | 24% | 20% | 17% | 7% | 0.85 | 0.99 |
| PI36 | 2.55 | 1.19 | 22% | 30% | 24% | 17% | 6% | 0.87 | 0.99 |
| PI37 | 2.47 | 1.22 | 28% | 24% | 25% | 17% | 6% | 0.81 | 0.99 |
| PI38 | 2.51 | 1.24 | 27% | 26% | 24% | 17% | 7% | 0.81 | 0.99 |
| PI39 | 2.38 | 1.19 | 30% | 27% | 25% | 13% | 5% | 0.85 | 0.99 |
| PI40 | 2.53 | 1.29 | 29% | 23% | 24% | 16% | 8% | 0.75 | 0.99 |
| PI42 | 2.53 | 1.27 | 28% | 25% | 22% | 18% | 7% | 0.80 | 0.99 |
| PI46 | 2.49 | 1.21 | 27% | 25% | 27% | 14% | 7% | 0.87 | 0.99 |
| PI47 | 2.40 | 1.24 | 31% | 25% | 23% | 15% | 6% | 0.81 | 0.99 |
| PI48 | 2.47 | 1.16 | 24% | 31% | 26% | 14% | 6% | 0.89 | 0.99 |
| PI49 | 2.06 | 1.17 | 44% | 24% | 18% | 10% | 4% | 0.74 | 0.99 |
| PI50 | 2.27 | 1.20 | 36% | 24% | 21% | 16% | 4% | 0.75 | 0.99 |
| PI51 | 2.06 | 1.14 | 43% | 26% | 17% | 13% | 2% | 0.76 | 0.99 |
| PI52 | 2.28 | 1.21 | 37% | 21% | 24% | 13% | 5% | 0.86 | 0.99 |
| PI53 | 2.34 | 1.17 | 31% | 25% | 27% | 12% | 5% | 0.86 | 0.99 |
| PI54 | 2.20 | 1.36 | 45% | 20% | 13% | 13% | 9% | 0.72 | 0.99 |
| PI55 | 2.24 | 1.20 | 37% | 24% | 21% | 14% | 4% | 0.75 | 0.99 |
| PI56 | 2.61 | 1.21 | 21% | 30% | 24% | 16% | 8% | 0.82 | 0.99 |
Assessment of IRT Assumptions (Monotonicity, Dimensionality and Local Independence)
The overall coefficient alpha for the pain interference items was 0.99 and single item deletions had no impact on the scale alpha (see Table 2). The item-rest correlations had a mean of 0.82, minimum of 0.72, and maximum of 0.89 (see Table 2). A categorical one-factor model fit with Mplus yielded the following fit statistics: CFI=0.97, TLI=0.97, RMSEA=0.10. Standardized item factor loadings ranged from 0.79 to 0.93. The largest absolute residual correlation after extracting one factor was 0.18 (PI50 How often did pain prevent you from sitting for more than 30 minutes? and PI55 How often did pain prevent you from sitting for more than one hour?); and none exceeded the 0.20 threshold used in PROMIS®.
IRT Parameters from Graded Response Model (GRM)
All items had adequate model fit statistics (p>0.05), per thresholds for fit statistics stated in the Methods section, except PI49 (How much did pain interfere with your ability to remember things?). Because the p-value is non-significant (p=0.04), this item was retained in the analyses. Item parameters for the Spanish data estimated with a GRM are presented in Table 3. The mean slope parameter was 2.81, the minimum was 1.97 and maximum was 3.75. The item difficulties were estimated by computing the mean of the four threshold values for each item. The resulting mean item difficulty was 0.15, the minimum was −0.12 and the maximum was 0.73.
Table 3.
Spanish language item parameters from graded response model.
| Item | Slope | Threshold 1 | Threshold 2 | Threshold 3 | Threshold 4 | Mean Threshold |
|---|---|---|---|---|---|---|
| PI1 | 2.10 | −0.96 | −0.06 | 0.90 | 2.24 | 0.53 |
| PI3 | 2.91 | −1.55 | −0.49 | 0.40 | 1.56 | −0.02 |
| PI5 | 3.14 | −1.52 | −0.55 | 0.38 | 1.44 | −0.06 |
| PI6 | 2.80 | −1.24 | −0.36 | 0.61 | 1.61 | 0.15 |
| PI8 | 2.24 | −1.64 | −0.47 | 0.52 | 1.67 | 0.02 |
| PI9 | 3.25 | −1.77 | −0.50 | 0.52 | 1.68 | −0.02 |
| PI10 | 2.90 | −1.71 | −0.57 | 0.37 | 1.47 | −0.11 |
| PI11 | 2.51 | −1.53 | −0.37 | 0.54 | 1.68 | 0.08 |
| PI12 | 3.18 | −1.67 | −0.55 | 0.35 | 1.40 | −0.12 |
| PI13 | 3.04 | −1.28 | −0.34 | 0.55 | 1.63 | 0.14 |
| PI14 | 3.22 | −1.38 | −0.46 | 0.46 | 1.51 | 0.03 |
| PI16 | 2.47 | −1.45 | −0.50 | 0.54 | 1.57 | 0.04 |
| PI17 | 3.26 | −1.10 | −0.28 | 0.67 | 1.61 | 0.22 |
| PI18 | 3.21 | −1.57 | −0.47 | 0.48 | 1.34 | −0.06 |
| PI19 | 2.02 | −1.78 | −0.53 | 0.43 | 1.54 | −0.09 |
| PI20 | 3.23 | −1.57 | −0.46 | 0.29 | 1.40 | −0.08 |
| PI22 | 3.51 | −1.53 | −0.44 | 0.45 | 1.39 | −0.03 |
| PI24 | 2.71 | −1.58 | −0.58 | 0.51 | 1.78 | 0.04 |
| PI26 | 3.21 | −1.20 | −0.27 | 0.68 | 1.69 | 0.23 |
| PI29 | 2.84 | −1.20 | −0.29 | 0.72 | 1.81 | 0.26 |
| PI31 | 3.75 | −1.28 | −0.31 | 0.52 | 1.44 | 0.09 |
| PI32 | 2.52 | −1.59 | −0.68 | 0.48 | 1.75 | −0.01 |
| PI34 | 3.75 | −1.48 | −0.41 | 0.49 | 1.48 | 0.02 |
| PI35 | 3.12 | −1.03 | −0.21 | 0.50 | 1.43 | 0.17 |
| PI36 | 3.74 | −1.40 | −0.34 | 0.48 | 1.42 | 0.04 |
| PI37 | 2.48 | −1.23 | −0.38 | 0.54 | 1.69 | 0.15 |
| PI38 | 2.58 | −1.27 | −0.34 | 0.53 | 1.52 | 0.11 |
| PI39 | 3.01 | −1.14 | −0.22 | 0.72 | 1.63 | 0.25 |
| PI40 | 2.02 | −1.23 | −0.35 | 0.54 | 1.52 | 0.12 |
| PI42 | 2.30 | −1.26 | −0.37 | 0.45 | 1.52 | 0.09 |
| PI46 | 3.33 | −1.22 | −0.37 | 0.57 | 1.43 | 0.10 |
| PI47 | 2.44 | −1.12 | −0.25 | 0.64 | 1.62 | 0.22 |
| PI48 | 3.63 | −1.33 | −0.29 | 0.62 | 1.48 | 0.12 |
| PI49 | 2.05 | −0.69 | 0.14 | 1.03 | 2.04 | 0.63 |
| PI50 | 2.01 | −0.93 | −0.09 | 0.79 | 2.14 | 0.48 |
| PI51 | 2.04 | −0.72 | 0.19 | 1.01 | 2.42 | 0.73 |
| PI52 | 3.21 | −0.89 | −0.20 | 0.71 | 1.65 | 0.32 |
| PI53 | 3.23 | −1.07 | −0.24 | 0.76 | 1.68 | 0.28 |
| PI54 | 1.97 | −0.60 | 0.15 | 0.72 | 1.48 | 0.44 |
| PI55 | 2.04 | −0.90 | −0.04 | 0.85 | 2.05 | 0.49 |
| PI56 | 2.47 | −1.56 | −0.43 | 0.47 | 1.43 | −0.02 |
Identification of DIF and Assessment of Impact
LORDIF collapses adjacent categories when sparse data is detected (<5 responses). Due to sparse English data in category 5 (Very Much) for item PI51 How often did pain prevent you from sitting for more than 10 minutes?, the number of categories for this item in the English and Spanish data was reduced from 5 to 4 by collapsing the categories “Very Much” with “Quite a Lot.” Results from LORDIF analysis show that 1 item had significant DIF (Table 4). This item PI39, asks about pain interfering with completing simple tasks, (exact wording not provided due to proprietary issues). Comparing OLR models 1 and 3 showed overall significant DIF for this item. In addition, the comparison of OLR models 1 and 2 indicates that it had significant uniform DIF (pseudo R-squared difference was 0.02). Figure 1 shows the Test Characteristic Curves for all 41 items in English and Spanish (plot on left) and the single item with DIF (plot on right). The area between the English and Spanish curves in each plot provides an indication of DIF impact. As seen in this figure, the information maximum occurs between −2 and 2 on the theta scale.
Table 4.
Spanish and English DIF Results using LORDIF Comparison of OLR Models1
| Item | Number of Categories | Test for Overall DIF2 (R2 value) | Test for Uniform DIF3 (R2 value) | Non-Uniform DIF4 (R2 value) |
|---|---|---|---|---|
| PI1 | 5 | 0.01 | 0.01 | 0.00 |
| PI3 | 5 | 0.01 | 0.00 | 0.00 |
| PI5 | 5 | 0.00 | 0.00 | 0.00 |
| PI6 | 5 | 0.01 | 0.01 | 0.00 |
| PI8 | 5 | 0.01 | 0.01 | 0.00 |
| PI9 | 5 | 0.00 | 0.00 | 0.00 |
| PI10 | 5 | 0.01 | 0.00 | 0.00 |
| PI11 | 5 | 0.00 | 0.00 | 0.00 |
| PI12 | 5 | 0.00 | 0.00 | 0.00 |
| PI13 | 5 | 0.00 | 0.00 | 0.00 |
| PI14 | 5 | 0.00 | 0.00 | 0.00 |
| PI16 | 5 | 0.00 | 0.00 | 0.00 |
| PI17 | 5 | 0.01 | 0.01 | 0.00 |
| PI18 | 5 | 0.00 | 0.00 | 0.00 |
| PI19 | 5 | 0.00 | 0.00 | 0.00 |
| PI20 | 5 | 0.01 | 0.01 | 0.00 |
| PI22 | 5 | 0.01 | 0.01 | 0.00 |
| PI24 | 5 | 0.00 | 0.00 | 0.00 |
| PI26 | 5 | 0.00 | 0.00 | 0.00 |
| PI29 | 5 | 0.01 | 0.01 | 0.00 |
| PI31 | 5 | 0.00 | 0.00 | 0.00 |
| PI32 | 5 | 0.00 | 0.00 | 0.00 |
| PI34 | 5 | 0.01 | 0.01 | 0.00 |
| PI35 | 5 | 0.00 | 0.00 | 0.00 |
| PI36 | 5 | 0.00 | 0.00 | 0.00 |
| PI37 | 5 | 0.00 | 0.00 | 0.00 |
| PI38 | 5 | 0.00 | 0.00 | 0.00 |
| PI39 | 5 | 0.02 | 0.02 | 0.00 |
| PI40 | 5 | 0.01 | 0.01 | 0.00 |
| PI42 | 5 | 0.01 | 0.01 | 0.00 |
| PI46 | 5 | 0.00 | 0.00 | 0.00 |
| PI47 | 5 | 0.00 | 0.00 | 0.00 |
| PI48 | 5 | 0.02 | 0.02 | 0.00 |
| PI49 | 5 | 0.00 | 0.00 | 0.00 |
| PI50 | 5 | 0.01 | 0.01 | 0.00 |
| PI51 | 4 | 0.01 | 0.01 | 0.00 |
| PI52 | 5 | 0.00 | 0.00 | 0.00 |
| PI53 | 5 | 0.00 | 0.00 | 0.00 |
| PI54 | 5 | 0.00 | 0.00 | 0.00 |
| PI55 | 5 | 0.00 | 0.00 | 0.00 |
| PI56 | 5 | 0.00 | 0.00 | 0.00 |
Pseudo R2 p-value ≥ 0.02 indicating statistically significant DIF.
Model 1 (intercept + ability) versus Model 3 (Model 2 + ability* group)
Model 1 (intercept + ability) versus Model 2 (Model 1 + group)
Model 2 (Model 1 + group) versus Model 3 (Model 2 + ability* group)
Figure 1.
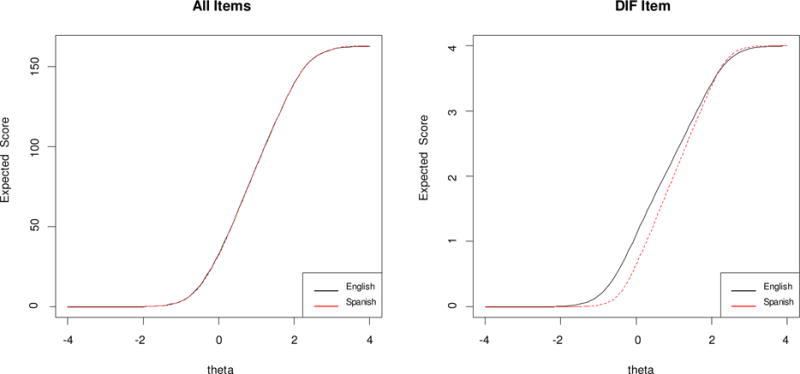
Comparison of test characteristic curves (TCC) for English and Spanish with all items (left) and only DIF items (right).
Figure 2 illustrates the impact of DIF on respondent scores. The plots show the difference between scores computed with the DIF item (initial) included and scores computed excluding the DIF item (purified). The plot on the left shows a box plot of these differences whereas the plot on the right shows these differences as a function of initial thetas separately for English and Spanish. A difference of less than zero indicates that the purified score exceeded the initial score and a difference that is greater than zero indicates that the initial score exceeded the purified score.
Figure 2.
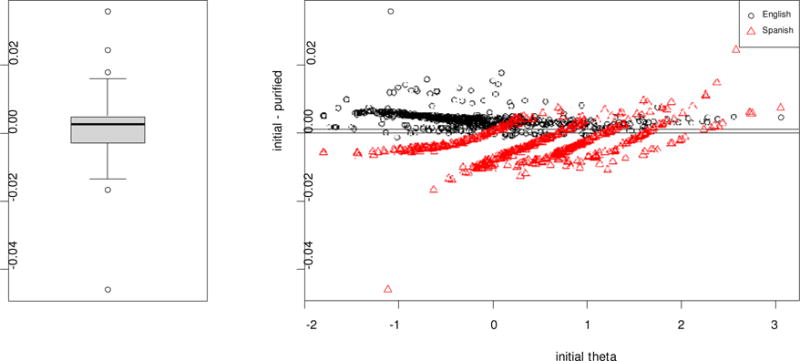
Assessment of Individual-Level DIF impact.
The box plot provided in Figure 2 shows the magnitude of the difference between the theta (underlying state or trait) scores produced when DIF is ignored and when DIF is accounted for by the exclusion of the item with DIF. The median difference in the Pain Interference item bank is less than 0.005 on the theta scale. As a point of reference, 0.50 on the theta scale is approximately one half standard deviation. Therefore, one can infer that the impact of the item with DIF is small and could probably be ignored when group comparisons are based on all items in the item bank.
Discussion
One of the goals of the PROMIS® initiative is the improvement of the precision of measurement of health conditions and comparability of health outcomes measures across different populations. Most PROMIS® item banks have been translated from English to Spanish to facilitate research with Spanish-speakers. However, comparisons between different language groups will only be valid if the items are unbiased with respect to language or if the bias is accounted for through statistical adjustment. In this study, in which we were conservative making no adjustments for multiple comparisons in order to identify any potential DIF, we found that 1 of the 41 items in the Pain Interference item bank was significantly biased when we examined the English and Spanish version of the items. The item asks about pain interfering with completing simple tasks, (exact wording not provided due to proprietary issues). It was administered with a five-level response scale ranging from Never to Always. The impact of this item was small and therefore can be ignored when administered with the whole item bank and the original item parameters can be used. However, since this item was not retained due to proprietary issues, there is no need for any further language-specific item parameter use.
One of the main advances of PROMIS® is the use of computer adaptive testing (CAT) to measure health outcomes including pain interference. Under CAT, items are selectively administered depending on a respondent’s position on the latent trait continuum. Thus, when CAT is used only a subset of the item bank is used to arrive at a theta score for an individual and the impact of DIF items in the bank will vary depending on the total number of items administered and whether the items with DIF are selected. Hence, without knowing the item set to be used for a respondent apriori, the impact of DIF among the items in a bank is impossible to predict. As previously mentioned, the item flagged for DIF in this analysis was dropped from the item bank, so there is no need to use language-specific item parameters when estimating PROMIS® PI item bank scores. Spanish specific parameters have been computed and are provided in Table 3.
The generalizability of this study’s results may be limited by the representativeness of the Spanishspeaking sample available for this study. According to the 2010 US Census, 38% of Latinos have less than a high school diploma, 27% have a high school diploma, 23% have some college or an associates degree and 13% have a bachelor’s degree or higher. Other data indicate that among Latinos, Spanish-speakers in the US have lower educational attainment than English speakers.5 By contrast, in our sample 20% have less than a high school diploma, 33% have a high school diploma, 33% have some college or an associates degree, and 34% have a bachelor’s degree or higher. These contrasts suggest our sample is more educated than Spanish-speakers in the US and may also differ on other important related attributes such as income, occupation and acculturation.24 All of these variables might be affecting the way subjects respond to these questions and therefore the exact reason for the DIF is unknown; it could be a language difference, a cultural difference, or something more broadly related to acculturation. In addition, the study reported here and previous PROMIS® Pain Interference analyses assume normality of the latent trait distribution.25 Finally, the results of this study should be replicated in other samples before final conclusions can be reached about the validity of comparisons between Spanish and English speaking groups.
Acknowledgments
Compliance with Ethical Standards
This study was supported in part by an NIH cooperative agreement (1U54AR057951). Sylvia H. Paz and Ron D. Hays received support from the University of California, Los Angeles (UCLA) and Charles Drew University (CDU), Resource Centers for Minority Aging Research Center for Health Improvement of Minority Elderly (RCMAR/CHIME) under NIH/NIA Grant P30-AG021684. Sylvia H. Paz was also supported by the UCLA Clinical and Translational Science Institute (CTSI) under NIH/NCATS Grant Number UL1TR000124. Ron D. Hays was also supported by UCLA/DREW Project EXPORT, NIMHD, (2P20MD000182). Karen L. Spritzer and Ron D. Hays were also supported by the NIH/NCI PCAR Grant (1U2-CCA186878-01).
Appendix A.
PROMIS® Pain Interference Item Bank*
| Item | Response Options** | Item Stem | |
|---|---|---|---|
| English | Spanish | ||
| PI1 | A | How difficult was it for you to take in new information because of pain? | ¿Cuánta dificultad tuvo para entender información nueva debido al dolor? |
| PI3 | A | How much did pain interfere with your enjoyment of life? | ¿En qué medida el dolor interfirió en su capacidad para disfrutar de la vida? |
| PI5 | A | How much did pain interfere with your ability to participate in leisure activities? | ¿En qué medida el dolor interfirió en su capacidad para participar en actividades durante su tiempo libre? |
| PI6 | A | How much did pain interfere with your close personal relationships? | ¿En qué medida el dolor interfirió en sus relaciones personales cercanas? |
| PI8 | A | How much did pain interfere with your ability to concentrate? | ¿En qué medida el dolor interfirió en su capacidad para concentrarse? . |
| PI9 | A | How much did pain interfere with your day to day activities? | ¿En qué medida el dolor interfirió en sus actividades diarias? |
| PI10 | A | How much did pain interfere with your enjoyment of recreational activities? | ¿En qué medida el dolor interfirió en su capacidad para disfrutar de actividades recreativas? |
| PI11 | A | How often did you feel emotionally tense because of your pain? | ¿Con qué frecuencia sintió tensión emocional debido al dolor? |
| PI12 | A | How much did pain interfere with the things you usually do for fun? | ¿En qué medida el dolor interfirió en las actividades que hace habitualmente para divertirse? |
| PI13 | A | How much did pain interfere with your family life? | ¿En qué medida el dolor interfirió en su vida familiar? |
| PI14 | A | How much did pain interfere with doing your tasks away from home (e.g., getting groceries, running errands)? | ¿En qué medida el dolor interfirió en su capacidad para realizar tareas fuera del hogar (p. ej., hacer la compra o los mandados)? |
| PI16 | B | How often did pain make you feel depressed? | ¿Con qué frecuencia el dolor le hizo sentirse deprimido/a? |
| PI17 | A | How much did pain interfere with your relationships with other people? | ¿En qué medida el dolor interfirió en sus relaciones con otras personas? |
| PI18 | A | How much did pain interfere with your ability to work (include work at home)? | ¿En qué medida el dolor interfirió en su capacidad para trabajar (incluya el trabajo en el hogar)? |
| PI19 | A | How much did pain make it difficult to fall asleep? | ¿En qué medida el dolor le dificultó dormirse? |
| PI20 | A | How much did pain feel like a burden to you? | ¿En qué medida sintió que el dolor era una carga para usted? |
| PI22 | A | How much did pain interfere with work around the home? | ¿En qué medida el dolor interfirió en el trabajo en el hogar? |
| PI24 | B | How often was pain distressing to you? | ¿Con qué frecuencia se sintió afligido/a por el dolor? |
| PI26 | B | How often did pain keep you from socializing with others? | ¿Con qué frecuencia el dolor le impidió socializar con otras personas? |
| PI29 | B | How often was your pain so severe you could think of nothing else? | ¿Con qué frecuencia el dolor fue tan agudo que no pudo pensar en nada más? |
| PI31 | A | How much did pain interfere with your ability to participate in social activities? | ¿En qué medida el dolor interfirió en su capacidad para participar en actividades sociales? |
| PI32 | B | How often did pain make you feel discouraged? | ¿Con qué frecuencia el dolor le hizo sentirse desanimado/a? |
| PI34 | A | How much did pain interfere with your household chores? | ¿En qué medida el dolor interfirió en sus tareas domésticas? |
| PI35 | A | How much did pain interfere with your ability to make trips from home that kept you gone for more than 2 hours? | ¿En qué medida el dolor interfirió en su capacidad para hacer viajes desde su hogar que le obligaran a estar fuera durante más de 2 horas? |
| PI36 | A | How much did pain interfere with your enjoyment of social activities? | ¿En qué medida el dolor interfirió en su capacidad para disfrutar de actividades sociales? |
| PI37 | B | How often did pain make you feel anxious? | ¿Con qué frecuencia el dolor le hizo sentirse ansioso/a? |
| PI38 | B | How often did you avoid social activities because it might make you hurt more? | ¿Con qué frecuencia evitó las actividades sociales porque podrían causarle más dolor? |
| PI39 | B | Pain interfering with completing simple tasks.*** | Interferencia del dolor con completar tareas simples. |
| PI40 | B | How often did pain prevent you from walking more than 1 mile? | ¿Con qué frecuencia el dolor le impidió caminar más de 1 milla? |
| PI42 | B | How often did pain prevent you from standing for more than one hour? | ¿Con qué frecuencia el dolor le impidió estar de pie durante más de una hora? |
| PI46 | B | How often did pain make it difficult for you to plan social activities? | ¿Con qué frecuencia el dolor le dificultó planear actividades sociales? |
| PI47 | B | How often did pain prevent you from standing for more than 30 minutes? | ¿Con qué frecuencia el dolor le impidió estar de pie durante más de 30 minutos? |
| PI48 | A | How much did pain interfere with your ability to do household chores? | ¿En qué medida el dolor interfirió en su capacidad para realizar tareas domésticas? |
| PI49 | A | How much did pain interfere with your ability to remember things? | ¿En qué medida el dolor interfirió en su capacidad para recordar cosas? |
| PI50 | B | How often did pain prevent you from sitting for more than 30 minutes? | ¿Con qué frecuencia el dolor le impidió permanecer sentado/a durante más de 30 minutos? |
| PI51 | B | How often did pain prevent you from sitting for more than 10 minutes? | ¿Con qué frecuencia el dolor le impidió permanecer sentado/a durante más de 10 minutos? |
| PI52 | B | How often was it hard to plan social activities because you didn’t know if you would be in pain? | ¿Con qué frecuencia le resultó difícil planear actividades sociales por no saber si tendría dolor? |
| PI53 | B | How often did pain restrict your social life to your home? | ¿Con qué frecuencia el dolor limitó su vida social al hogar? |
| PI54 | C | How often did pain keep you from getting into a standing position? | ¿Con qué frecuencia el dolor le impidió ponerse de pie? |
| PI55 | B | How often did pain prevent you from sitting for more than one hour? | ¿Con qué frecuencia el dolor le impidió permanecer sentado/a durante más de una hora? |
| PI56 | A | How irritable did you feel because of pain? | ¿En qué medida se sintió irritable debido al dolor? |
Time frame was “past 7 days” for all items.
- Not at all/A Little Bit/Somewhat/Quite a bit/Very much (Nada/Un poco/Algo/Mucho/Muchísimo)
- Never/Rarely/Sometimes/Often/Always (Nunca/Rara vez/Algunas veces/A menudo/Siempre)
- Never/Once a week or less/Once every few days/Once a day/Every few hours (Nunca/Una vez a la semana o menos/Una vez cada pocos días/ Una vez al día/Una vez cada pocas horas)
Exact wording not included due to proprietary issues (item not included in final PROMlS® PI item bank).
Footnotes
None of the authors Sylvia H. Paz, Karen L. Spritzer, or Ron D. Hays had any conflicts of interest to declare.
All procedures performed involving human participants were in accordance with the ethical standards of the governing institutional review boards and with the 1964 Helsinki declaration and its later amendments or comparable ethical standards.
References
- 1.Amtmann D, Cook KF, Jensen MP, et al. Development of a PROMIS item bank to measure pain interference. Pain. 2010;150(1):173–182. doi: 10.1016/j.pain.2010.04.025. [DOI] [PMC free article] [PubMed] [Google Scholar]
- 2.http://www.census.gov/prod/cen2010/briefs/c2010br-04.pdf.
- 3.https://www.census.gov/newsroom/facts-for-features/2015/cb15-ff18.htm.
- 4.http://www.census.gov/newsroom/releases/pdf/cb13ff-19sp_hispanicheritage.pdf.
- 5.http://www.pewhispanic.org/2015/05/12/english-proficiency-on-the-rise-among-latinos/.
- 6.Cella D, Riley W, Stone A, et al. The Patient-Reported Outcomes Measurement Information System (PROMIS) developed and tested its first wave of adult self-reported health outcome item banks: 2005–2008. Journal of Clinical Epidemiology. 2010;63:1179–1194. doi: 10.1016/j.jclinepi.2010.04.011. [DOI] [PMC free article] [PubMed] [Google Scholar]
- 7.Cella D, Hernandez L, Bonomi AE, Corona M, Vaquero M, Shiomoto G, et al. Spanish language translation and initial validation of the functional assessment of cancer therapy quality-of-life instrument. Medical Care. 1998;36:1407–1418. doi: 10.1097/00005650-199809000-00012. [DOI] [PubMed] [Google Scholar]
- 8.http://www.nihpromis.org/measures/translations.
- 9.https://us.toluna.com/.
- 10.http://dgim.ucsf.edu/diversity/SASH_manual.pdf.
- 11.Reeve BB, Hays RD, Bjorner JB, et al. PROMIS Cooperative Group. Psychometric evaluation and calibration of health-related quality of life item banks: plans for the Patient-Reported Outcomes Measurement Information System (PROMIS) Med Care. 2007 May;45(5 Suppl 1):S22–31. doi: 10.1097/01.mlr.0000250483.85507.04. [DOI] [PubMed] [Google Scholar]
- 12.Embretson S, Reise S. Item Response Theory for Psychologists. First Psychology Press; 2000. [Google Scholar]
- 13.MPlus: Muthen & Muthen www.statmodel.com/.
- 14.Morales LS, Flowers C, Gutierrez P, et al. Item and scale differential functioning of the mini-mental state exam assessed using the Differential Item and Test Functioning (DFIT) framework. Medical Care. 2006;44:S143–S151. doi: 10.1097/01.mlr.0000245141.70946.29. [DOI] [PMC free article] [PubMed] [Google Scholar]
- 15.Samejima F. Estimation of latent ability using a response pattern of graded scores. Psychometrika Monogr. 1969;(17) [Google Scholar]
- 16.Samejima F. Graded response model. In: van der Linden WJ, Hambleton RK, editors. Handbook of Modern Item Response Theory. New York, NY: Springer; 1997. pp. 85–100. [Google Scholar]
- 17.Bjorner JB, Smith KJ, Stone C, Sun X. IRTFIT: A Macro for Item Fit and Local Dependence Tests Under IRT Models. QualityMetric Incorporated; Lincoln, RI, USA: 2007. [Google Scholar]
- 18.Orlando M, Thissen D. Further investigation of the performance of S - χ2: An item fit index for use with dichotomous item response theory models. Applied Psychological Measurement. 2003;27:289–298. [Google Scholar]
- 19.Teresi JA, Kleinman M, Ocepek-Welikson K. Modern psychometric methods for detection of differential item functioning: application to cognitive assessment measures. Stat Med, 15–30. 2000;19(11–12):1651 83. doi: 10.1002/(sici)1097-0258(20000615/30)19:11/12<1651::aid-sim453>3.0.co;2-h. [DOI] [PubMed] [Google Scholar]
- 20.Liu H, Cella DF, Gershon R, Shen J, Morales LS, Riley W, et al. Representativeness of the PROMIS internet panel. Journal of Clinical Epidemiology. 2010;63(11):11691178. doi: 10.1016/j.jclinepi.2009.11.021. [DOI] [PMC free article] [PubMed] [Google Scholar]
- 21.Gershon RC, Rothrock N, Hanrahan R, Bass M, Cella D. The use of PROMIS and assessment center to deliver patient-reported outcome measures in clinical research. J Appl Meas. 2010;11(3):304–14. [PMC free article] [PubMed] [Google Scholar]
- 22.Choi SW, Gibbons LE, Crane PK. Lordif: An R Package for Detecting Differential Item Functioning Using Iterative Hybrid Ordinal Logistic Regression/Item Response Theory and Monte Carlo Simulations. J Stat Softw. 2011 Mar 1;39(8):1–30. doi: 10.18637/jss.v039.i08. [DOI] [PMC free article] [PubMed] [Google Scholar]
- 23.https://cran.r-project.org/web/packages/lordif/lordif.pdf
- 24.Hays RD, Liu H, Kapteyn A. Use of internet panels to conduct surveys. Beh Res Methods. 2015;47(3):685–690. doi: 10.3758/s13428-015-0617-9. [DOI] [PMC free article] [PubMed] [Google Scholar]
- 25.Crins MHP, Roorda LD, Smits N, et al. Calibration and Validation of the Dutch-Flemish PROMIS Pain Interference Item Bank in Patients with Chronic Pain. PLOS ONE. 2015 doi: 10.1371/journal.pone.0134094. [DOI] [PMC free article] [PubMed] [Google Scholar]