Figure 1.

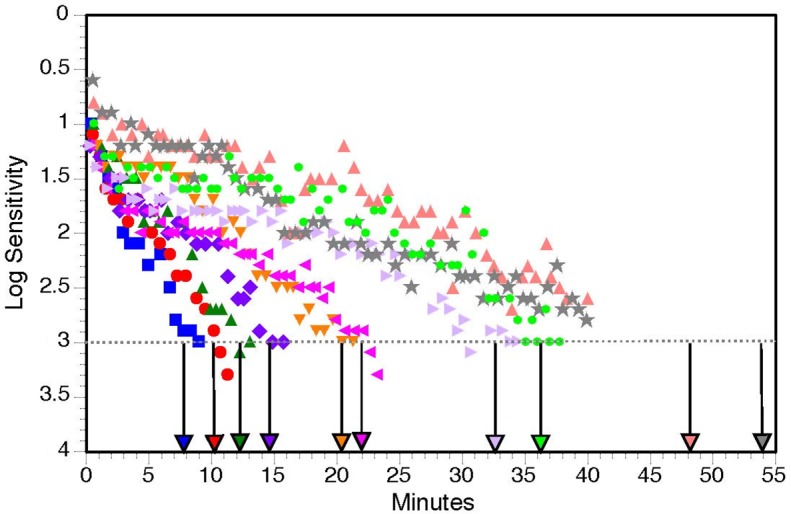
Examples of dark adaptation plots for participants at baseline illustrating very fast recovery to very slow recovery of sensitivity. Color-coded vertical arrows above the abscissa indicate RIT computed by the AdaptDx for that participant.

Examples of dark adaptation plots for participants at baseline illustrating very fast recovery to very slow recovery of sensitivity. Color-coded vertical arrows above the abscissa indicate RIT computed by the AdaptDx for that participant.