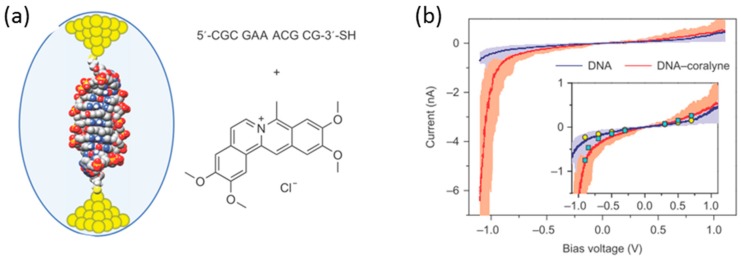
Figure 15.
(a) Molecular junction composed of the DNA(5′-CGCGAAACGCG-3′-SH)–coralyne (right) complex; (b) Average I–V curves (solid line) over 40 individual curves (light shadow) of native DNA (blue) and DNA–coralyne complex (red). Inset: Graph overlay of I–V curves with static current values (yellow circles, native DNA; cyan squares, DNA–coralyne complex) under different bias voltages [45].

