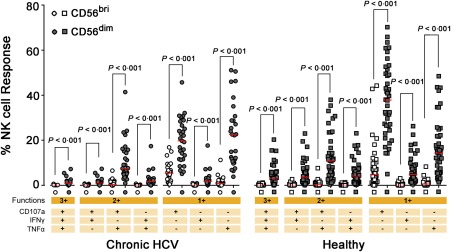
Figure 4.

Comparision of natural killer‐mediated antibody‐dependent cellular cytotoxicity (NK‐ADCC) responses mediated by CD56dim NK cells and CD56bri NK subset. The functional profile of CD56dim and CD56bri subsets stimulated with antibody‐coated p815 cells was shown. The percentages of CD107a/interferon (IFN)‐γ/tumour necrosis factor (TNF)‐α single‐, double‐ or triple‐positive NK cells in the respective subset were shown and the red bar indicated median value. Comparisons between groups were performed using Mann–Whitney U‐test. All P‐values were two‐tailed and considered significant when lower than 0·05. [Colour figure can be viewed at wileyonlinelibrary.com].
