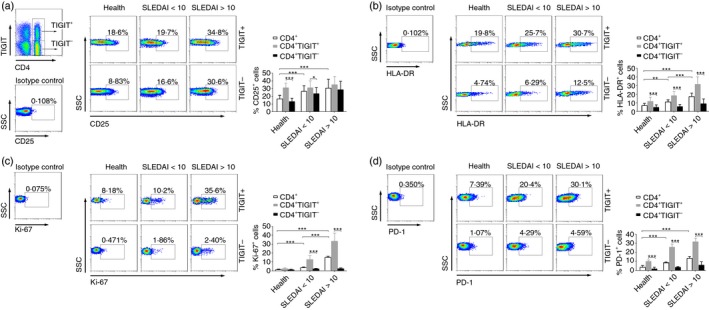
Figure 3.

TIGIT expression on activated CD4+ T cells in patients with systemic lupus erythematosus (SLE). Peripheral blood of healthy individuals and patients with SLE with different groups of SLE activity index (SLEDAI) was collected for analysis of the phenotypic characteristics of TIGIT + or TIGIT − CD4+ T cells. (a) Representative FACS plots showing the expression of CD25, (b) HLA‐DR, (c) Ki‐67, and (d) PD‐1 on TIGIT + or TIGIT − CD4+ T cells in different groups. The percentages of CD25+, HLA‐DR +, Ki‐67+ and PD‐1+ cells in TIGIT + or TIGIT − CD4+ T cells from healthy individuals, patients with SLE with SLEDAI < 10, and patients with SLE with SLEDAI > 10 are shown as the mean ± SD, n = 10 to n = 17 subjects per group. Data are pooled from three or four independent experiments. *P < 0·05, **P < 0·01, ***P < 0·001 (Mann–Whitney U‐test). [Colour figure can be viewed at wileyonlinelibrary.com]
