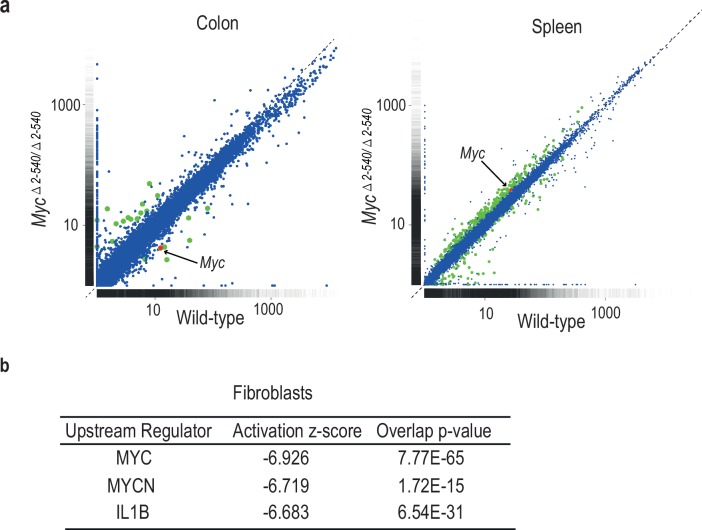
Figure 5. Differential effect of Myc△2–540/△2–540 deletion on MYC target gene expression.
(a) Scatter plot comparing the average Fragments per kilobase of exons per million fragments mapped (FPKM) values of gene transcripts in colon and spleen of wild-type (n = 4) and Myc△2–540/△2–540 (n = 4) mice. Genes showing significant (q < 0.05) differential expression are marked in red (Myc) or green (other genes). For median FPKM values of gene transcripts see Figure 5—figure supplement 1 (b) Upstream regulator analysis of RNA-seq data shows that the highest ranked potential regulator affected in the slow growing Myc△2–540/△2–540 fibroblasts is MYC. The activation z-scores are to infer the activation states of predicted upstream regulators. The overlap p-values were calculated from all the regulator-targeted differential expression genes using Fisher’s Exact Test. Two independent Myc△2–540/△2–540 fibroblasts lines were analysed to confirm the downregulation of Myc. Ingenuity pathway analysis performed on one of these is shown.
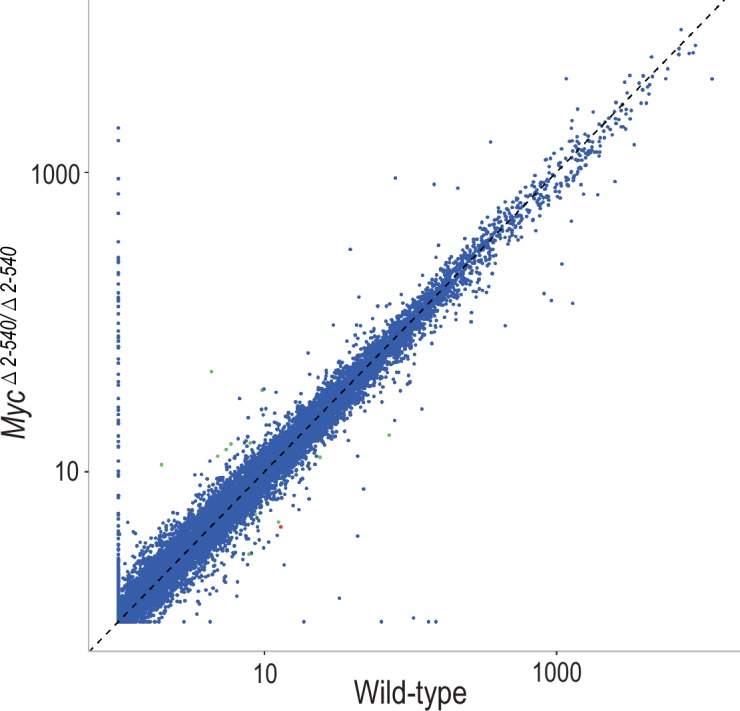
Figure 5—figure supplement 1. Scatter plot comparing the median of FPKM values of gene transcripts in colon of wild-type (n = 4) and Myc△2–540/△2–540 (n = 4) mice.


