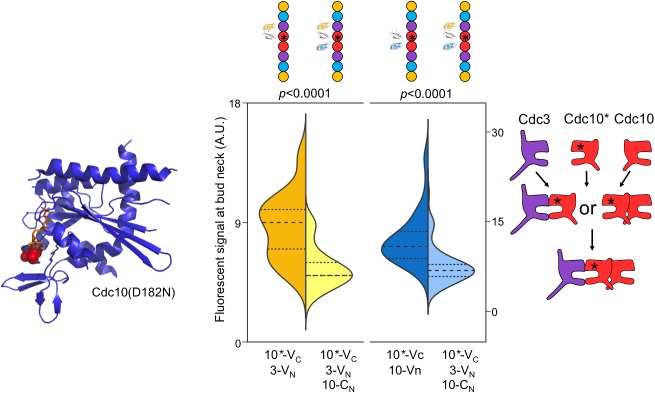
Figure 3. Perturbing GTP binding by Cdc10 disrupts the order of interactions with Cdc3.
Left, ribbon diagram of Sept2-GppNHp (PDB 3FTQ) models the location of the mutated Asp residue (red spheres) and bound nucleotide (orange). Center, violin plot of CSD-BiFC results, as in Figure 2C but with Cdc10(D182N)-VC (‘10*-VC’, ‘Cdc10*'). Right, cartoon of inferred order of assembly. From left to right, n = 60, 51, 95, and 62. Strains used were: 10(D182N)-VC/3-VN, 10(D182N)/10-CN, and 10(D182N)-VC/3-VN/10CN.

