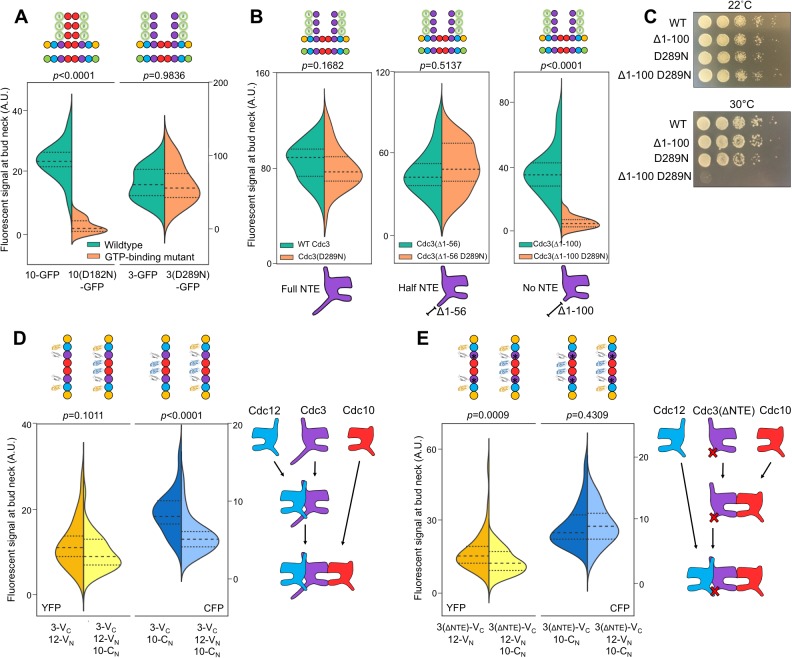
Figure 5. The order of Cdc3 oligomerization is controlled by the Cdc3 N-terminal extension.
(A) Violin plot showing bud neck fluorescence for the indicated GFP-tagged alleles of Cdc10 or Cdc3 expressed from plasmids in WT cells (strain BY4741, plasmids pLA10, pCdc10-1-GFP, pCdc3-GFP, and YCpL-Cdc3(D289N)-GFP) cultured at 22°C to mid-log phase prior to imaging. From left to right, n = 14, 11, 14, and 10. (B) As in (A), but including plasmids (pCdc3-GFP, YCpL-Cdc3(D289N)-GFP, YCpL-Cdc3(Δ1–56)-GFP, YCpL-Cdc3(D289N, Δ1–56)-GFP, YCpL-Cdc3(Δ1100)-GFP, or YCpL-Cdc3(D289N, Δ1–100)-GFP) encoding Cdc3-GFP alleles with D289N and/or the indicated truncations of the NTE. From left to right, n = 35, 30, 25, 16, 28, and 27. (C) Dilution series of cdc10∆ cells (strain JTY5104 w/ Cdc3 covering plasmid pMVB100) carrying the plasmids from (B) grown on rich medium incubated at the indicated temperature. (D–E) CSD-BiFC experiment and interpretation as in Figure 2B, but with different strains (YEF5692, MMY0191, or 12-VN/10-CN) and Cdc3-VC or Cdc3(ΔNTE)-VC expressed from plasmids (YCpHU-Cdc3-VC or YCpHU-Cdc3(Δ1–100)-VC). (D) From left to right, n = 22, 37, 43, and 33. (E) From left to right, n = 37, 66, 42, and 57.
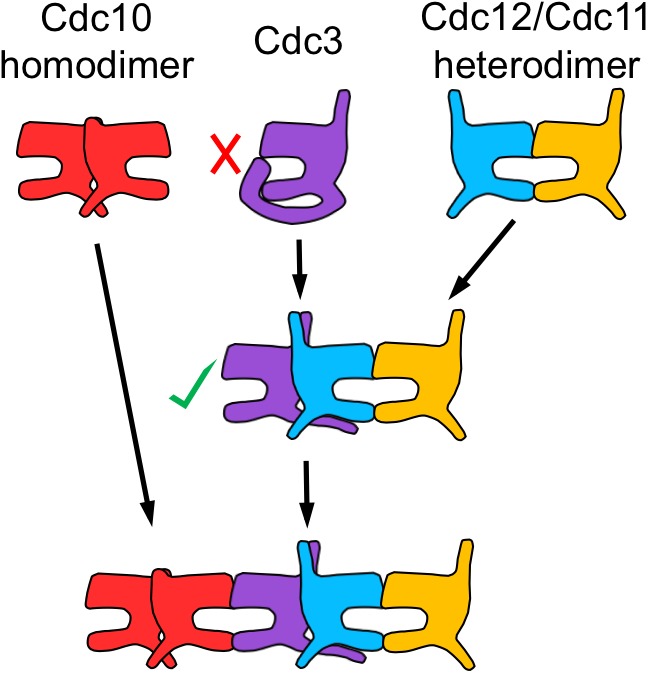
Figure 5—figure supplement 1. Proposed G-occlusion model of Cdc3 NTE function in septin oligomerization.


