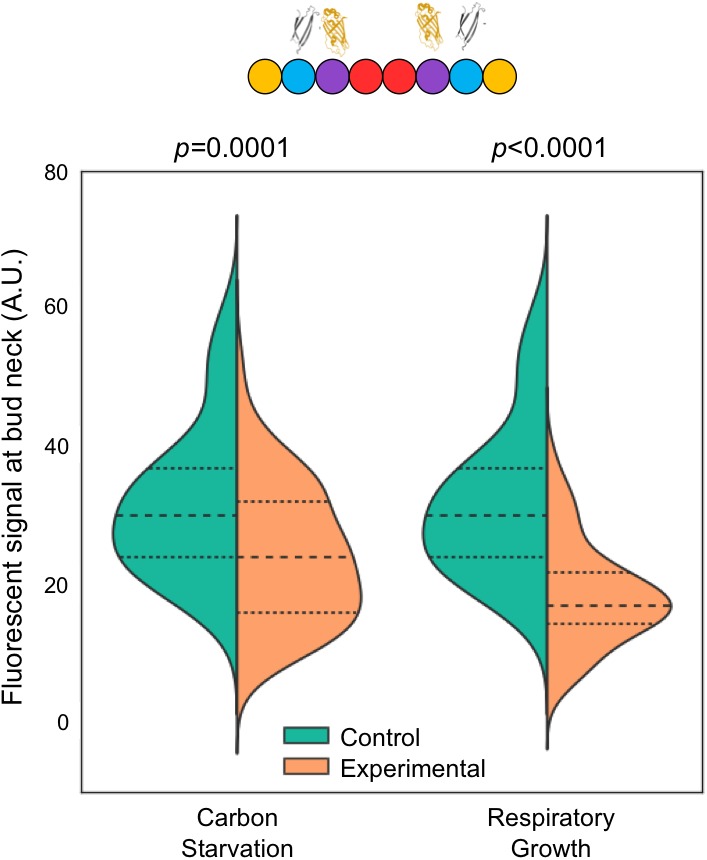
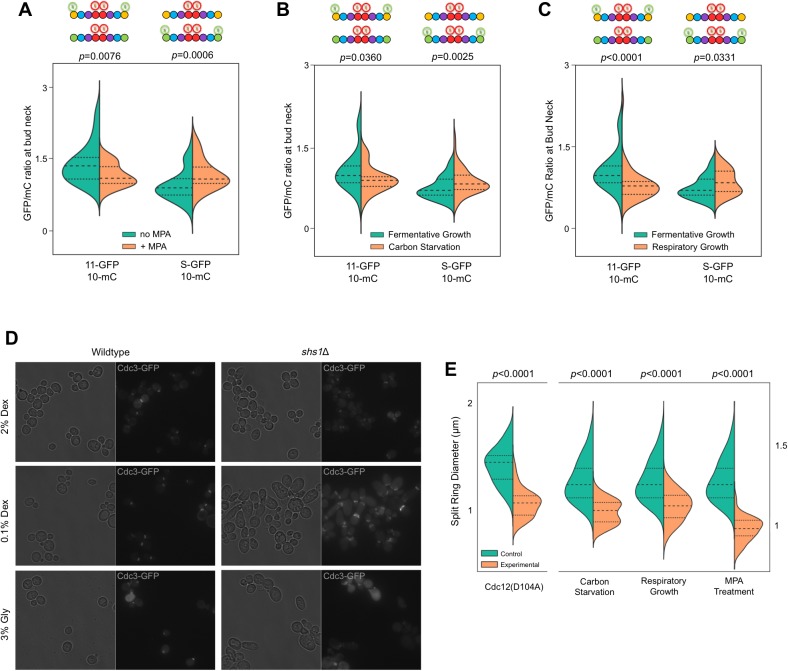
Figure 6. Recruitment of Cdc11 vs Shs1 by Cdc12 is sensitive to changes in the guanine nucleotide ratios.
(A–C) Violin plots showing Cdc11-GFP-to-Cdc10-mCherry or Shs1-GFP-to-Cdc10-mCherry ratios, as in Figure 4B, but with cells of strain JTY5396 or JTY5397 carrying no plasmid and exposed to various physiological conditions that alter the GTP:GDP ratio. (A) Treatment with 100 µg/ml MPA for 24 hr. From left to right, n = 35, 39, 48, and 26. (B) Media with 2% dextrose (fermentative growth; normal) or 0.1% dextrose (carbon starvation). From left to right, n = 31, 39, 57, and 58. (C) Media with 2% dextrose (fermentative growth) or 3% glycerol (respiratory growth). From left to right, n = 31, 47, 57, and 26. (D) Micrographs showing cell morphology for WT (BY4741) or shs1Δ (JTY3631) cells carrying a plasmid (pML109) expressing Cdc3-GFP in fermentative, carbon starvation, or respiratory growth conditions (YP w/2% dextrose, 0.1% dextrose, or 3% glycerol, respectively). (E) Septin ring diameters at split-ring phase. Violin plots showing ring diameters for cells of strain JTY5396 either carrying plasmids expressing WT Cdc12 (pFM650) or Cdc12(D104A) (YCpL-Cdc12(D104A)) on the left, or grown in the described conditions (control, YP w/2% dextrose;, carbon starvation, 0.1% dextrose; respiratory growth, 3% glycerol; or 2% dextrose w/100 µg/ml MPA) on the right. From left to right, n = 20, 28, 25, 33, 25, 24, 25, 30.
Figure 6—figure supplement 1. Non-pharmacological IMPDH inhibition reduces septin-septin interaction across the NC interface.


