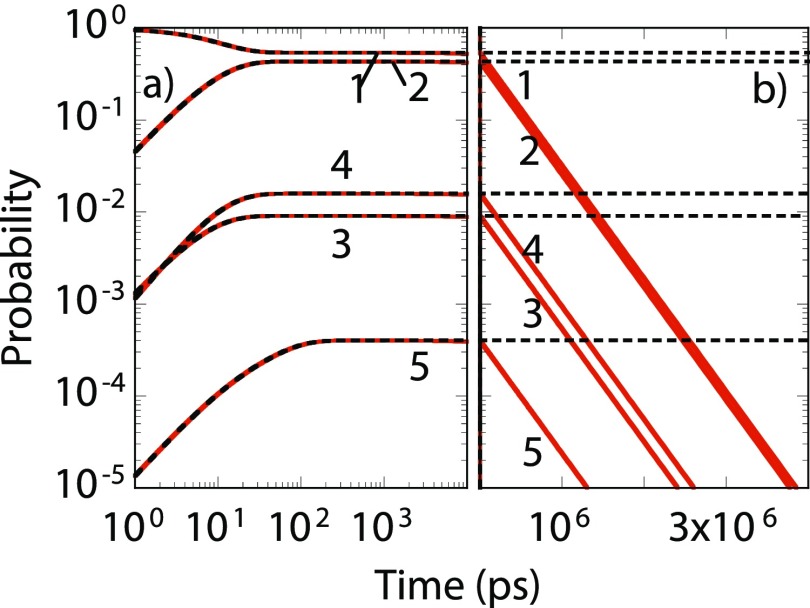
FIG. 3.
Occupation for core states (states 1-5) of Fig. 2 found by solving the core network [Eq. (8), dashed black line] and full network [Eq. (7), red line] models at (a) short (log-log) and (b) long (semilog) time scales. Both models were constructed using MD trajectories. The full network model denotes the worst-case scenario where probability leakage into periphery/missing states occurs because of which the core state occupations decay exponentially at long time scales. The core network model is a compact MSM that does not contain any periphery/missing states.

