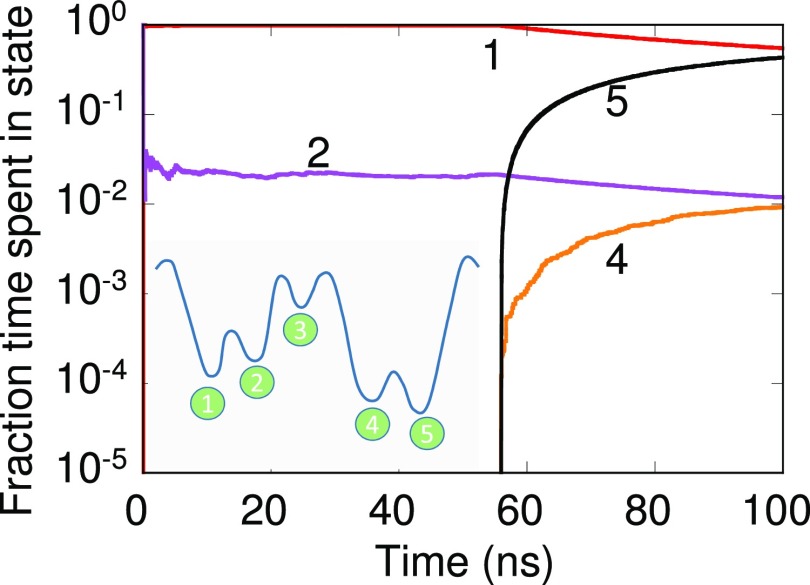
FIG. 4.
Fraction of time spent in states belonging to the 1-D network shown in the inset over the course of the simulation. The x-axis denotes the time elapsed in a dynamical trajectory. Energy barrier for forward moves from left to right are 0.3, 0.35, 0.1, and 0.2 eV. Barriers for backward moves from left to right are 0.2, 0.1, 0.45, and 0.3 eV. The system resides in state 2 at time t = 0 ps.

