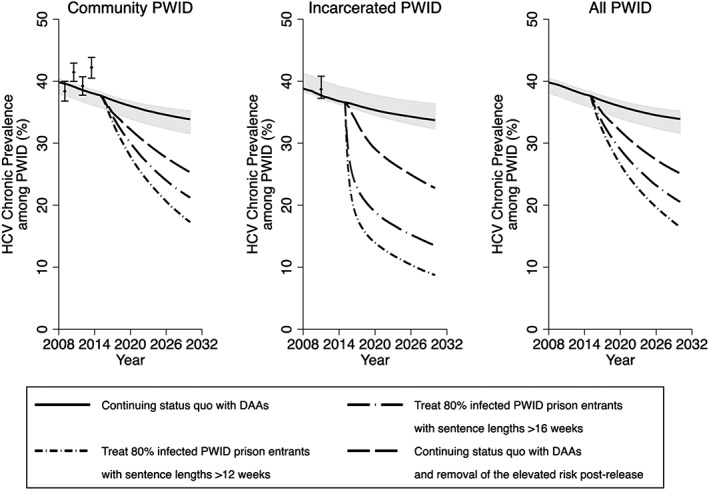
Figure 3.

Impact of different prevention and treatment scenarios on chronic hepatitis C virus (HCV) prevalence over time in Scotland among community people who inject drugs (PWID), incarcerated PWID and all PWID. Lines represent the median chronic HCV prevalence, with the shaded area representing the 95% credible interval (CrI) for the status quo projection (no scale‐up) from 2015 onwards. HCV prevalence data points shown for comparison with 95% confidence intervals. DAA = direct‐acting antiviral
