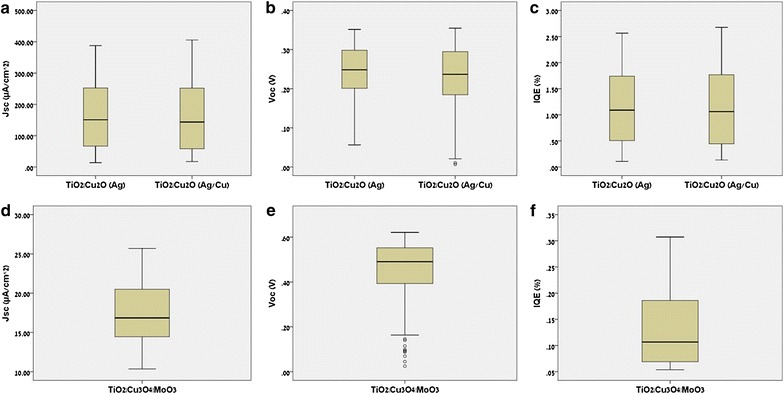
Fig. 4.

Boxplots of the three PV activities (J SC , Voc, and IQE). a–c The three PV activities distribution for the library (with Ag and Ag|Cu back contacts). d–f The three PV activities distribution for the library. The boxplots show the median values (solid horizontal line), 50th percentile values (box outline), the lower and upper quartile (whiskers, vertical lines), and outlier values (open circles)
