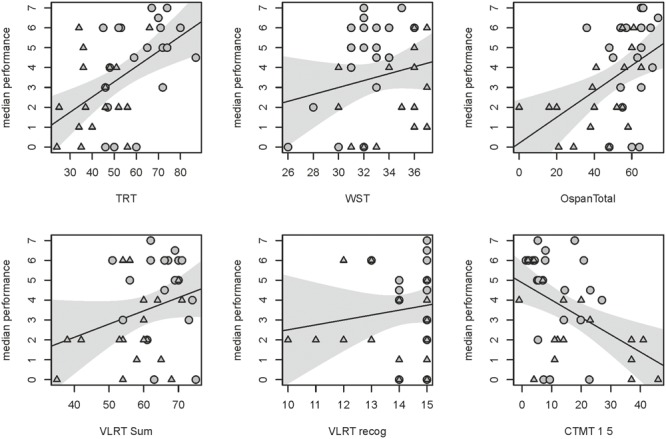
FIGURE 6.

Single correlations between six cognitive tests with highest VIP included in the model and the median performance in the noise-vocoded speech test. Regression lines with the respective confidence interval for a significance level of p-value of 0.05. Correlation coefficients and p-values of the respective tests from top left to bottom right: TRT (r = 0.53, p = 0.001); WST (r = 0.195, p = 0.24); Operation Span (r = 0.47, p = 0.002); sum of learned words in the Verbal Learning and Retention Test (VLRT; r = 0.27, p = 0.098); recognized words of the Verbal Learning and Retention Test (VLRT; r = 0.132, p = 0.428) and the Comprehensive Trail-Making Test (CTMT; r = –0.49, p = 0.002). Data of younger subjects are depicted by circles, data of older subjects by triangles.
