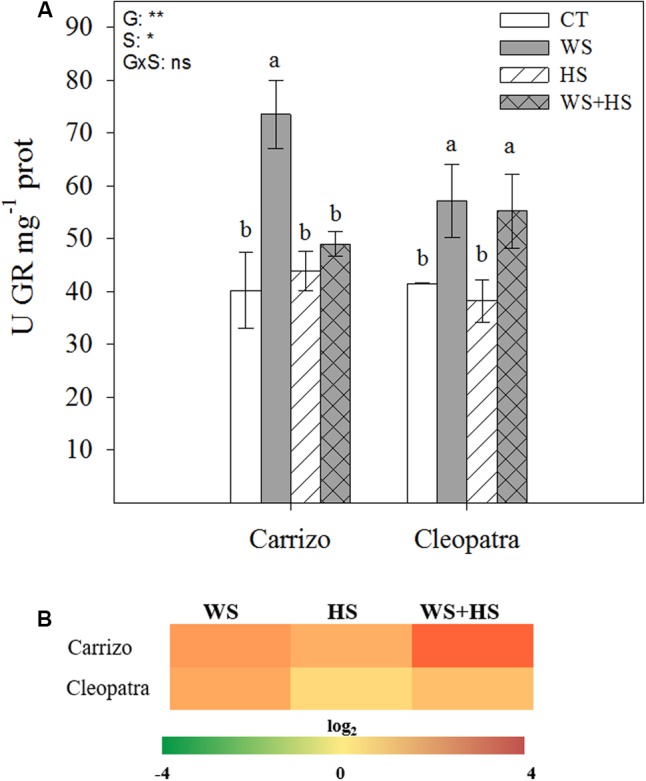
FIGURE 7.

Effects of drought (WS), heat (HS), and a combination of drought and heat stress (WS+HS) on GR activity (A) and transcript expression (B) in leaves of Carrizo and Cleopatra plants. Different letters denote statistical significance at p ≤ 0.05. G, genotypes; S, stress treatment; G×S, interaction genotype × stress treatment. ∗P < 0.05; ∗∗P < 0.01; ∗∗∗P < 0.001; ns, no statistical differences. Scale for gene expression is log2 of the mean values after normalization against control plants.
