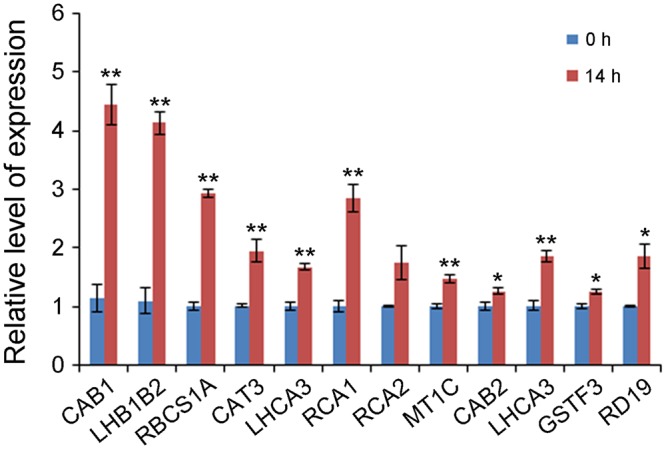
FIGURE 2.

Gene expression levels of 12 selected enriched unigenes under 0 and 14 h NaCl stress conditions by qRT-PCR. Y-axis represents gene expression relative to A. pumila Actin 2 (JZ151991). Significant differences at ∗∗P < 0.01 and ∗P < 0.05, respectively, according to Student’s t-test compared to wild type or mutant, respectively. Data represent the mean ± SE obtained from three biological replicates.
