FIGURE 4.

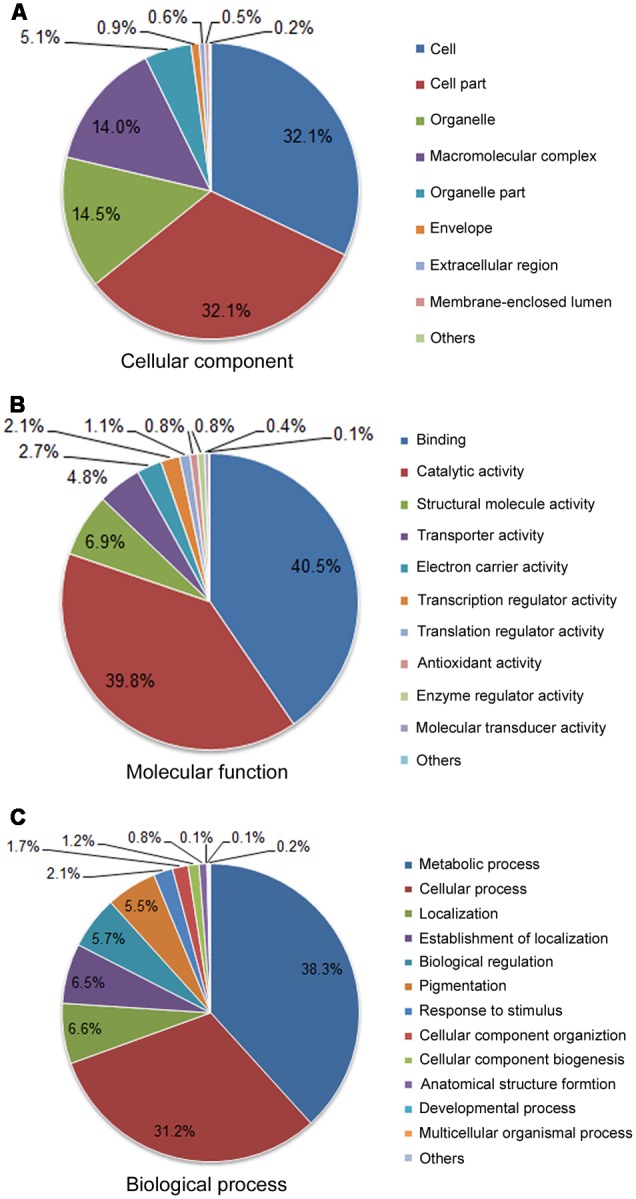
Functional classifications for the 8,835 unigenes assigned into GO terms. Pie diagrams represent the second-level GO terms for three categories: cell component (A), molecular function (B), and biological process (C).

Functional classifications for the 8,835 unigenes assigned into GO terms. Pie diagrams represent the second-level GO terms for three categories: cell component (A), molecular function (B), and biological process (C).