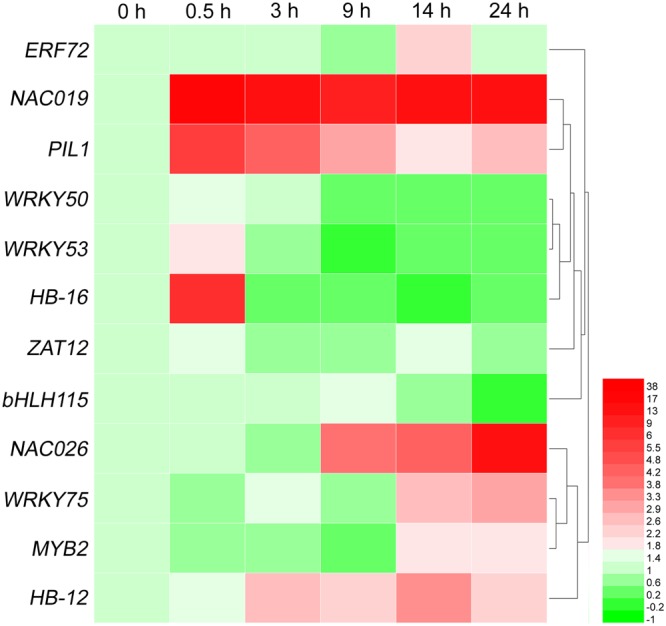
FIGURE 5.

Heat-map of differentially expressed genes of 12 transcription factor families at six time points of salt shock. Each line represents a different gene. Each color represents a different gene expression level. qRT-PCR was used to evaluate the relative levels of these unigenes at six time points of 500 mM NaCl stock. The patterns were clustered and visualized by heatmap program HemI 1.0 (Deng et al., 2014).
