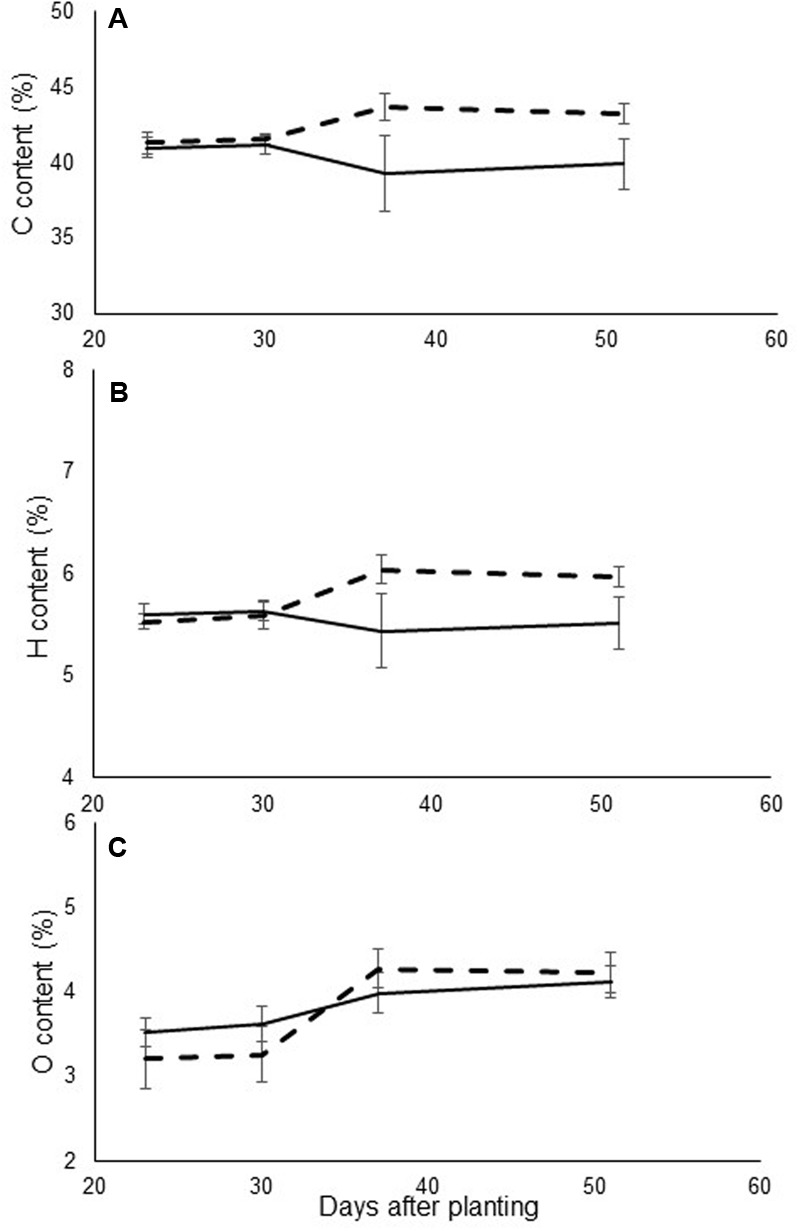
FIGURE 3.

(A) Carbon, (B) hydrogen, and (C) nitrogen content (% of total dry weight) of leaves in control (continuous line) and in O. cumana-infected (dashed line) susceptible sunflower plants. O. cumana infections appeared on plant roots 31 DAP. There were five replicates of each measurement. Bars represent standard errors of mean.
