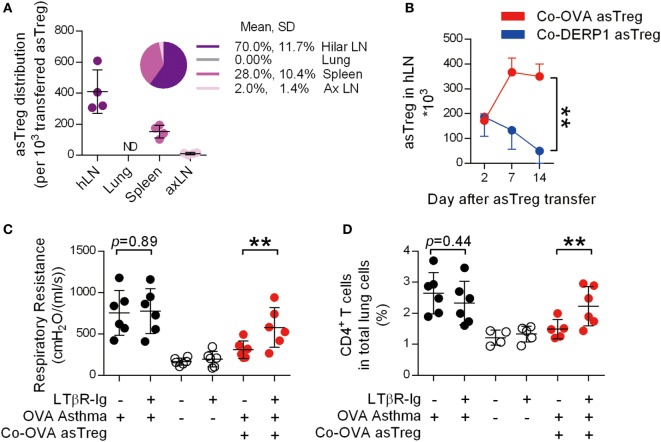
Figure 3.
Antigen-specific regulatory T cells (asTregs) accumulate in lung hilar lymph node (LN). (A) With the same model as Figure 2F, OVA-induced asthmatic recipient mice were analyzed for eGFP+ asTreg in lymphoid organs by FACS, 2 days after Co-OVA asTreg transfer. Shown are eGFP+ asTreg distributions in hLN, lung, spleen, and axillary lymph node (axLN). Each spot represents one mouse, n = 4. ND, not detectable. (B) hLN asTreg kinetics. On days 2, 7, and 14, eGFP+ asTregs were analyzed in hLN of Co-OVA asTreg (red line) or Co-DERP1-treated recipients (blue line) by FACS. n = 4. Respiratory resistance (C) and inflammatory infiltration (D) with or without hLN. Asthmatic (black dot), naïve (black circle), and Co-OVA treated (red dot) mice were analyzed. n = 6. Data shown represent three independent experiments.

