FIGURE 3.

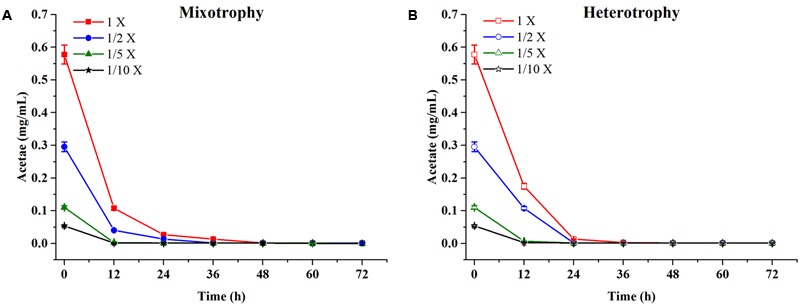
Acetate content profiles of C. reinhardtii under mixotrophic (A) and heterotrophic (B) conditions in four dilutions of EAB. Data are represented as the means ± SD (n = 3).

Acetate content profiles of C. reinhardtii under mixotrophic (A) and heterotrophic (B) conditions in four dilutions of EAB. Data are represented as the means ± SD (n = 3).