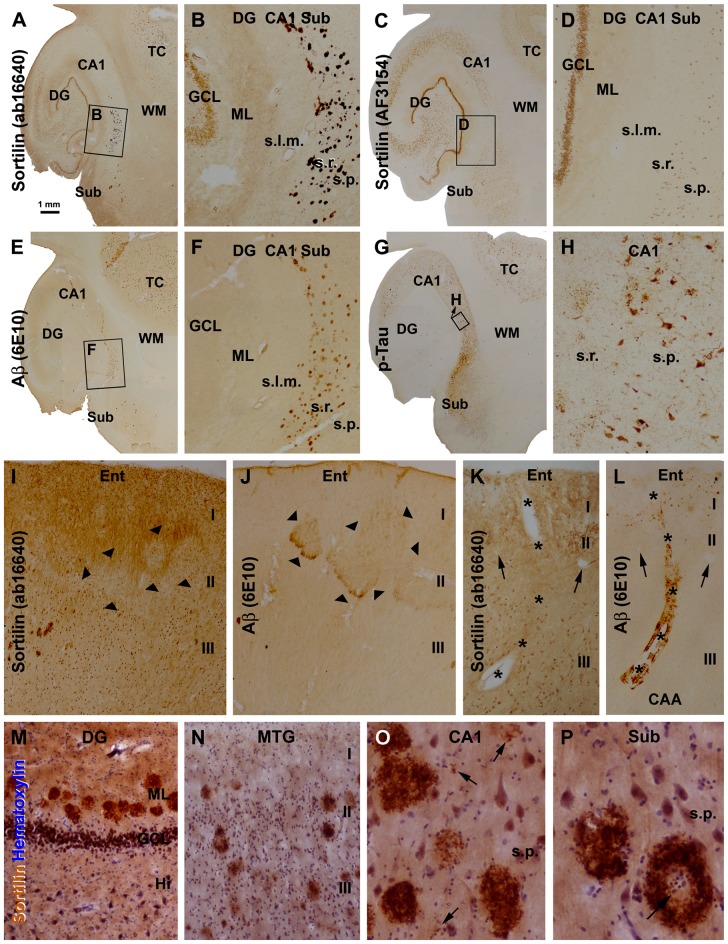
Figure 3.
Morphological characterization of sortilin labeled plaque lesions relative to amyloid and tau pathology using sections from cases with Alzheimer’s disease (AD). Panels (A–G) show low and high power (framed areas) views over the hippocampal formation and part of temporal cortex (TC) from adjacent sections, with the 4 markers as indicated. The rabbit sortilin antibody labels plaque lesions that are regionally matched to that labeled by the 6E10 β-amyloid (Aβ) antibody (A,B,E,F). Both the rabbit and goat sortilin antibodies label neuronal profiles seen clearly in the GCL at low magnification (a-d). Immunolabeling of phosphorylated Tau (p-Tau) is seen in tangled neurons and neuritic plaques (G,H). Panels (I,J) are images taken from adjacent sections of the entorhinal cortex (Ent) from another AD case, showing a lack of extracellular sortilin labeling at the layer II cell islands (pointed by arrowheads) that exhibited diffuse Aβ deposition. Panels (K,L) shows a lack of sortilin deposition in association with cerebral amyloid angiopathy (CAA), also as assessed between consecutive sections. Asterisks denote the trajectory of a longitudinally cut amyloid arteriole entering the cortex from pia surface, with the two arrowheads pointing to two cross-sectioned normal vessels, for additional spatial reference. Panels (M–P) show high magnification views of extracellular sortilin deposits in sections counterstained with hematoxylin. Plaques occur in the ML of the DG in a row (M), and in the cortex of the middle temporal gyrus (MTG) with different sizes and labeling intensity (N). Panel (O) shows the occurrence of small amount of deposits (pointed by arrows) in the neuropil in areas about the sizes of the cell nuclei and neuronal somata, along with densely packed mature-looking plaques. Panel (P) shows circular plaques with cell nuclei (arrows) in the center. Additional abbreviations: I-III, cortical layers; s.l.m., stratum lacunosum-moleculare; other abbreviations are as defined in Figure 1. Scale bar = 1 mm in (A) applying to (C,E,G); equivalent to 200 μm for (B,D,F,I,J), 50 μm for (K–N) and 25 μm for (O,P).

