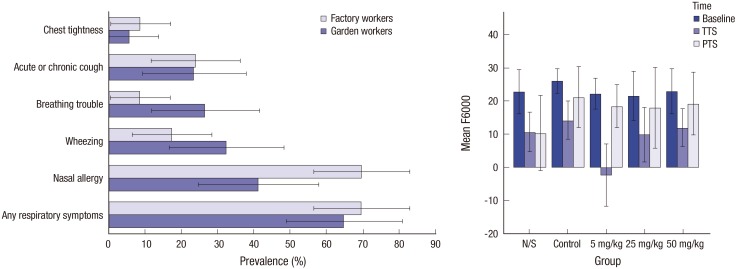
Fig. 1.
Examples of correct use of error bars. Left panel: The original legend reads “Prevalence of respiratory symptoms among the garden and factory workers. Error bars represent 95% CI” (10). Note that the error bar for the prevalence of “chest tightness” in “garden workers” is truncated at zero, as a negative prevalence is meaningless. Right panel: The original legend reads “Comparison of the response amplitude (vertical axis) at different frequencies (2–8 kHz [This is the graph for 6 kHz.]) in the study groups receiving various doses of atorvastatin. Error bars represent 95% CI of the mean. N/S stands for normal saline” (11). Note that some of the error bars extend to areas with negative amplitude response, as unlike the prevalence, a negative amplitude response does make sense (re-used with permission in accordance with the terms of the Creative Commons Attribution-NonCommercial 4.0 International License).
CI = confidence interval, N/S = normal saline, TTS = temporary threshold shift, PTS = permanent threshold shift.

