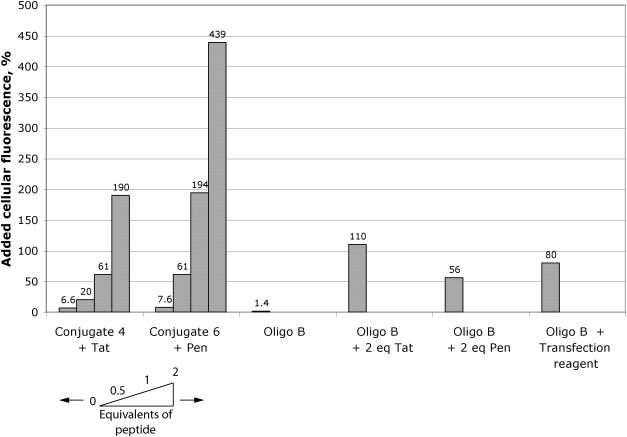
Figure 8.
Quantitation of internalized fluorescence. Percentage increase in cellular fluorescence over background levels for (left to right) addition of Tat peptide to 2.5 μM conjugate 4, addition of Penetratin peptide to 2.5 μM conjugate 6, compared to 2.5 μM Oligo B alone, 2.5 μM Oligo B with 2 equivalents of Tat peptide or 2 equivalents of Penetratin peptide and 0.5 μM oligo B with transfection agent Lipofectamine 2000.

