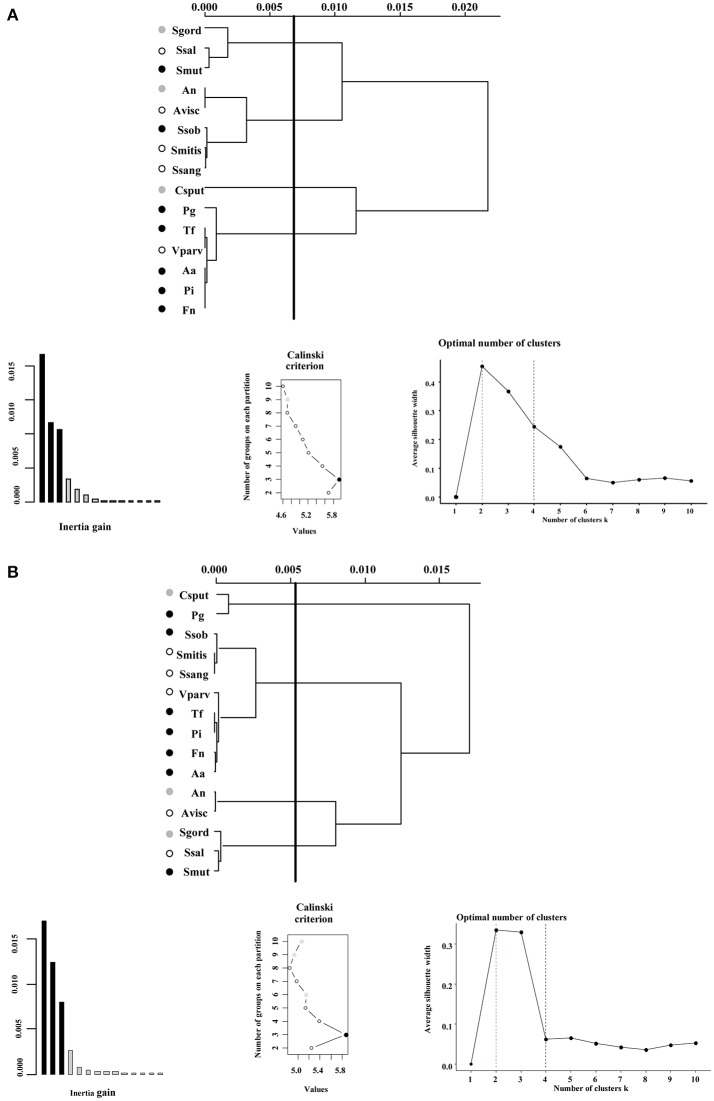
Figure 2.
Ward's method of hierarchical unsupervised clustering based on the respiratory activity triggered by substrates contained in the Biolog Phenotype microarray at (A) 24 h and (B) 48 h. The first 2 principal components of the multiple correspondence analysis were retained for cluster analysis. The x-axis of dendrogram represents the linkage distance measured by the Euclidean distance squared. The y-axis indicates the bacterial species included on each cluster. Brackets outline the clusters statistically significant at the 0.05% level and a vertical line indicates this cut-off linkage distance. The groups discussed in the text are colored as follows: health-associated species in white, commensals in gray, and disease-associated bacteria in black circles. Validation metrics of the clustering performance are included in the lower panel. On the left, the inertia explained by each of the clusters; on the center, the Calinski-Harabasz (CH) score indicating the optimal number of clusters; and on the right, the Silhouette scores. CH scores at different number of clusters are described in Supplementary Table 1.

