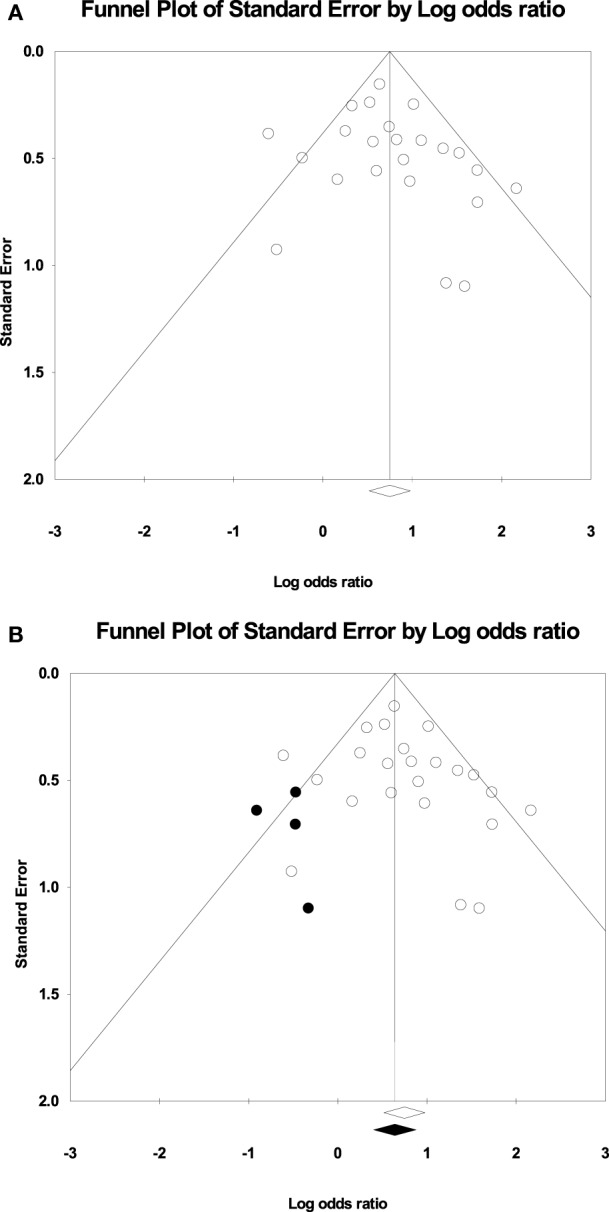
Figure 3.

(A) Funnel plot of the studies for the random effects model: The x-axis is the log odds ratio, and the y-axis is the standard error associated with each study. (B) Funnel plot with imputed studies. Open circles represent the 24 original studies whereas black circles represent imputed studies.
