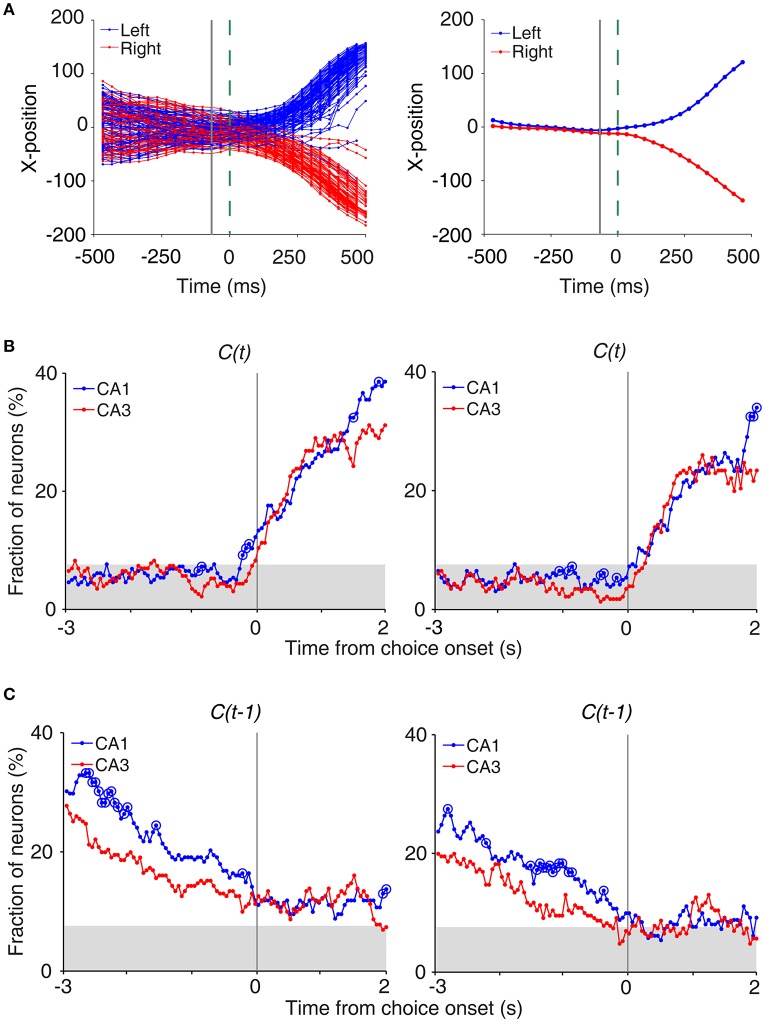
Figure 4.
Neural activity related to upcoming and previous choices on central stem. (A) Determination of the time of choice onset. Choice onset was when the difference in the animal's horizontal coordinate (X-position) of the left- and right-choice trials first became statistically significant. Shown are the time course of the animal's X-position data near the upper T-junction of the maze (Figure 1A) during an example session (left, individual trials; right, mean). Blue and red indicate trials associated with the left and right goal choices, respectively. The dashed line (0 ms) indicates the time of clear separation in the animal's X-positions according to its choice upon visual inspection, and the solid line corresponds to the time when the difference in the X-positions for the left- and right-choice trials first became statistically significant (i.e., choice onset; t-test, p < 0.05) within ±0.5 s window from time 0. (B) Choice signals around choice onset examined with 1 s (left) and 0.5 s (right) moving windows (50 ms time steps). (C) Previous choice signals examined with 1 s (left) and 0.5 s (right) moving windows (50 ms time steps). The same format as in Figure 3B.

