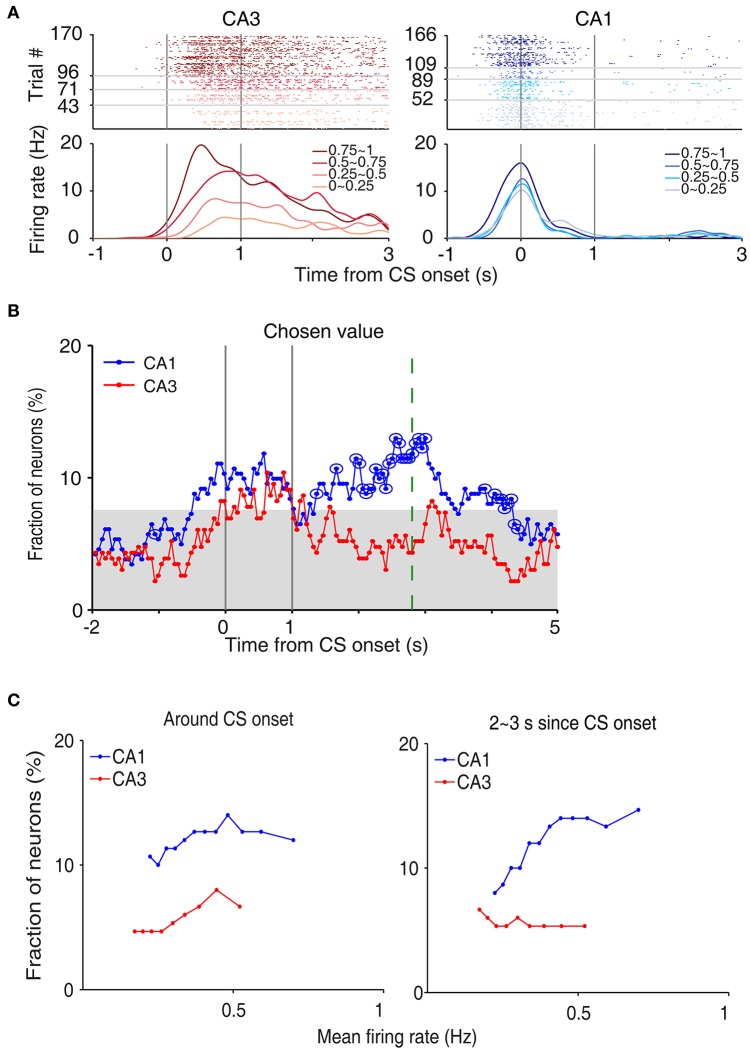
Figure 5.
Neural activity related to chosen value. (A) Two examples of chosen value-coding neurons. Trials were grouped according to chosen value (in quartiles). (B) Temporal profiles of chosen value signals. The same format as in Figure 3B. (C) Chosen-value signals as a function of firing rate (mean of 150 neurons, steps of 10 neurons). CA3 and CA1 units were aligned according to their mean discharge rates, and chosen value signals around CS onset (2 s window centered on CS onset) and during 2–3 s since CS onset were examined using a moving window of 150 neurons that was advanced in steps of 10 neurons (starting from the low-firing side).

