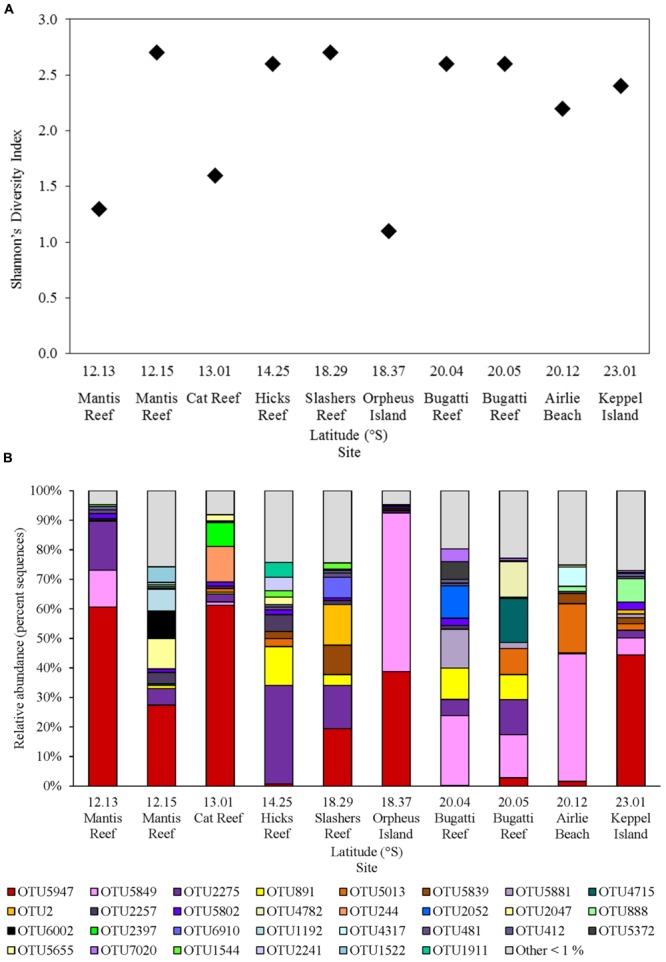
FIGURE 4.

Diazotroph assemblages within GBR surface waters, including (A) nifH diversity (Shannon’s index) of rarefied sequence data and (B) relative abundance of nifH OTUs (% of total sequences) clustered at 97% sequence similarity, with OTUs representing <1% of total sequences grouped as “Other <1%.”
