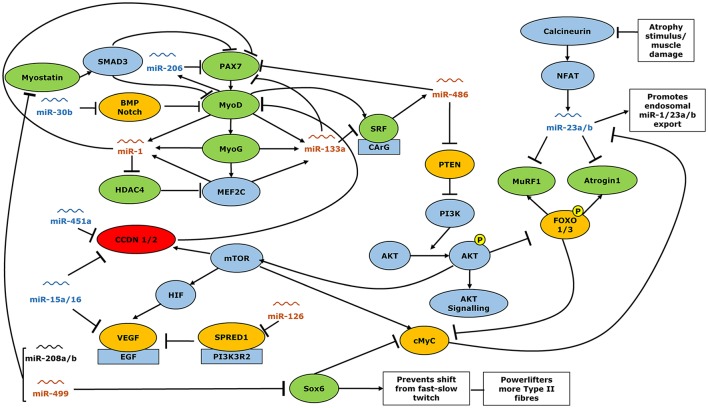
Figure 6.
Interactions of miRNA with expression gene expression of muscle function regulators. Orange miRs show greater expression in healthy controls than power lifters, blue miR showed lower expression in controls than power lifters. miRs shown in black were expressed similarly in power lifters and controls. Green genes more abundant in power lifters, red less abundant while yellow were unchanged. Arrowheads indicate a positive interaction while perpendicular lines indicate an inhibitory effect.

