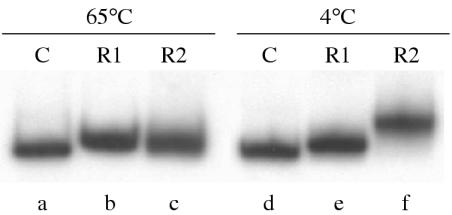
Figure 2.
Temperature dependency of the electrophoretical mobility of φ29 DNA fragments containing region 1 or 2. Region 1 (R1) was a 200 bp PCR fragment with the sequence from position +98 of promoter A2c to position −6 of promoter A2b start sites. Region 2 (R2) was a 195 bp PCR fragment with the sequence from position +5 of promoter A2c to position −69 of promoter A2b start sites. Control (C) was a 198 bp fragment containing from positions +102 to −96 of early promoter C2 start site (12). Lanes a–c and d–f, correspond to the native 4% acrylamide gel electrophoresis run at 65 and 4°C, respectively.

