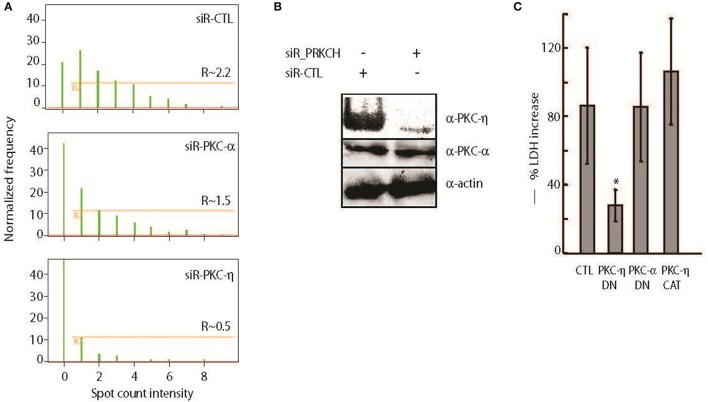
Figure 2.
PKC-η plays bigger role than PKC-α in unopsonized B. thailandensis intracellular survival and induction of host cell death. (A) Quantitative analysis of internalized Bt CDC2721121 was determined by plotting bacteria spot counts, 1–2 μm fluorescent puncti corresponding to bacteria size and fluorescent marker, against a normalized frequency, percentage of analyzed cells selected from the total number of single and focused cells. Bacterial counts in the cytoplasm that were singly labeled with FITC and not associated with the PE-labeled extracellular bacterial spots were calculated as described in the Materials and Methods. R, the gate excluding the cells exhibiting background fluorescence from the analysis, shows the mean value of fluorescence (MF) spots associated with intracellular bacteria per single host cell. R and NF (Normalized frequency) were determined by selective analysis of at least 5000 single and focused cells per sample using the IDEAS 5.0 software. A representative result of one out of 3 independent experiments is shown. (B) THP-1 cells were transfected with 50 nM siRNA against PRKCH or non-targeting control (CTL) siRNA and collected 72 h post treatment. Whole cell lysates were analyzed by Western blot using antibodies against PKC-η, PKC-α, and actin. (C) A549 cells transiently expressing PKC-η-DN, PKC-α-DN, and PKC-η-CAT, were infected with Bt CDC2721121 at MOI 50 for 1 h, treated with kanamycin (250 μg/ml) for 3 additional hours to suppress extracellular bacterial growth, after which the infected cells were cultured in antibiotic-free media. At 40 h post-infection, the percentage of dead A549 cells was calculated as a ratio of LDH activity in the conditioned media relative to total enzyme activity in the infected cells lysed with 0.1% Triton. The average and standard deviation from three independent experiments are shown. The “*” denotes statistical significance (p < 0.05) for % cell death in transfected samples compared to infected cells transfected with an empty vector (CTL) for each experimental condition.

