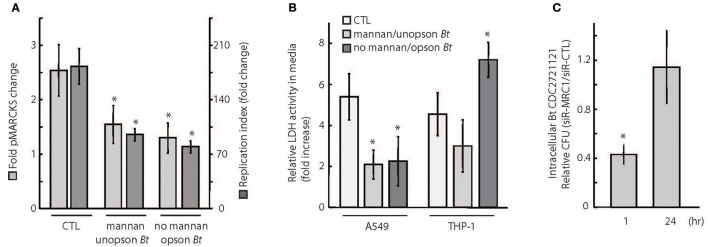
Figure 5.
Phagocytosis receptor usage determines the efficiency of intracellular Burkholderia proliferation. (A) A549 cells were (1) incubated with 3 mg/ml soluble mannan for 30 min and then infected with unopsonized Bt CDC2721121 at MOI 50, (2) not treated with mannan and infected with Bt CDC2721121 coated with anti-B.thailandensis rabbit serum (opson Bt), or (3) not treated with mannan and uninfected (CTL). pMARCKS levels in bacteria-infected cells were quantified and compared to uninfected cells. In parallel, A549 cells were collected after 2 h of infection for determination of intracellular bacterial counts. These cells were treated with 250 μg/ml kanamycin for 3 h to inhibit extracellular bacterial growth and incubated overnight in antibiotic-free media. At 24 h post-infection, a second set of samples were collected, and colony forming units (CFU) were calculated from limiting dilutions of the cell lysates incubated on nutrient agar for 24 h at 37°C. The replication index of intracellular Bt CDC2721121 was calculated as the CFU fold change at 24 vs. 2 h post-infection. The average and standard deviation from three independent experiments are shown. The “*” denotes statistical significance (p < 0.05) for fold change in pMARCKS and replication index in host cells treated with mannan or pathogen coated with serum, compared to CTL samples. (B) A549 and THP-1 cells were treated as described in (A), and LDH activity was measured in conditioned media 2 h post infection. After treatment with kanamycin (250 μg/ml) for 3 h, host cells were incubated for 24 h in antibiotic-free media and a second LDH measurement was taken. Relative LDH activity was determined as fold change between the 24 h and 2 h time points post-infection. The average and standard deviation from three independent experiments are shown. The “*” denotes statistical significance (p < 0.05) for relative LDH activity in experimental samples compared to untreated (CTL) samples. (C) A549 cells were treated with 25 nM siRNA targeting MRC1 or with non-targeting (CTL) siRNA and were infected with unopsonized Bt CDC2721121 at MOI 50. At 1 h and 24 h post-infection, cells were lysed with 0.1% Triton, and colony forming units (CFU) were calculated from limiting dilutions of the cell lysates incubated on nutrient agar for 24 h at 37°C. The ratio of CFU corresponding to intracellular bacteria from siR-MRC1 treated cells vs. cells treated with non-targeting siRNA is shown for each time point. The average mean and standard deviation from three independent experiments are shown. The “*” denotes statistical significance (p < 0.05) in number of CFUs between 1 and 24 h.

