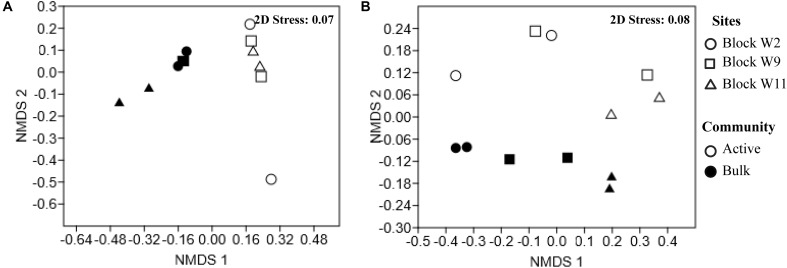
FIGURE 2.
Non-metric Multi-Dimensional Scaling (NMDS) of the Bray–Curtis similarity of the relative abundance of bacterial (A) and archaeal (B) communities reveal spatial variation by reservoir blocks and between the genomic and active communities. Each point represents an individual sample in the NMDS charts. Full circles represent the genomic communities (DNA-based); empty circles symbol active communities (cDNA-based). Sites are represented by different shapes, block W2 (circle), block W9 (square), block W11 (triangle).

