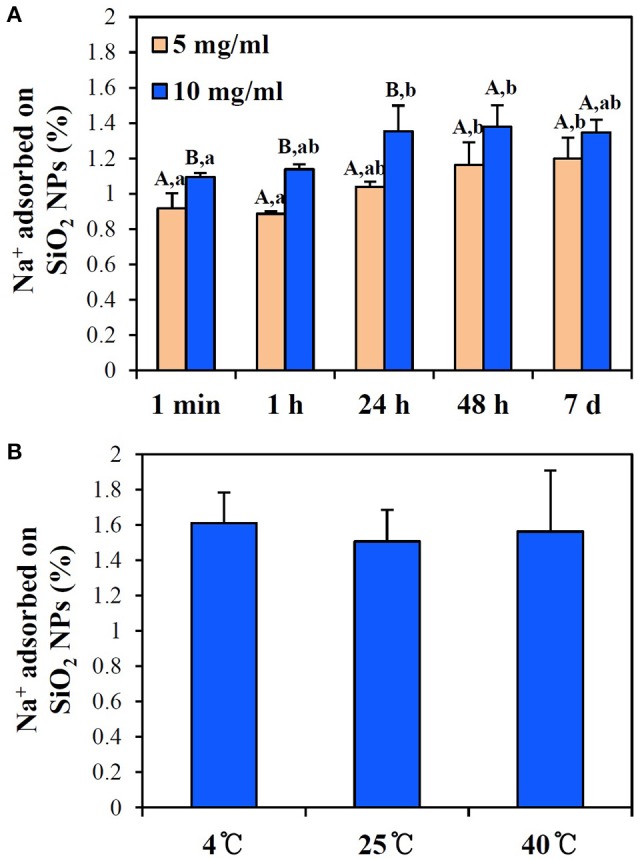
Figure 7.

ICP-AES analysis of the interactions between SiO2 NPs and Na+ in PBS buffer with respect to (A) incubation times at 25°C and (B) different temperatures at 10 mg/ml NPs after 24 h. (A) Different letters in majuscule (A,B) and in minuscule (a,b) indicate significant differences between NP concentrations and between incubation times, respectively (p < 0.05). (B) No significant differences between different temperatures were found (p > 0.05).
