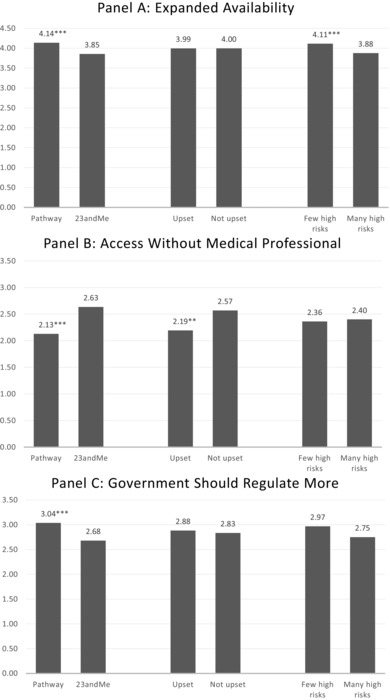
Figure 2.

Factors Associated With Consumers’ Attitudes About Availability (Panel A), Access (Panel B), and Regulation (Panel C) of Personal Genomic Testing
Figures plot the predicted mean values (all measured from 0 to 5) for the first 3 outcomes reported in Table 2. *P ≤ 0.05; **P ≤ 0.01; ***P ≤ 0.001 indicates significant difference for the indicated group relative to the paired group (eg, Pathway vs 23andMe; upset vs not upset; and few high risks vs many high risks).
