
FIG 2 .
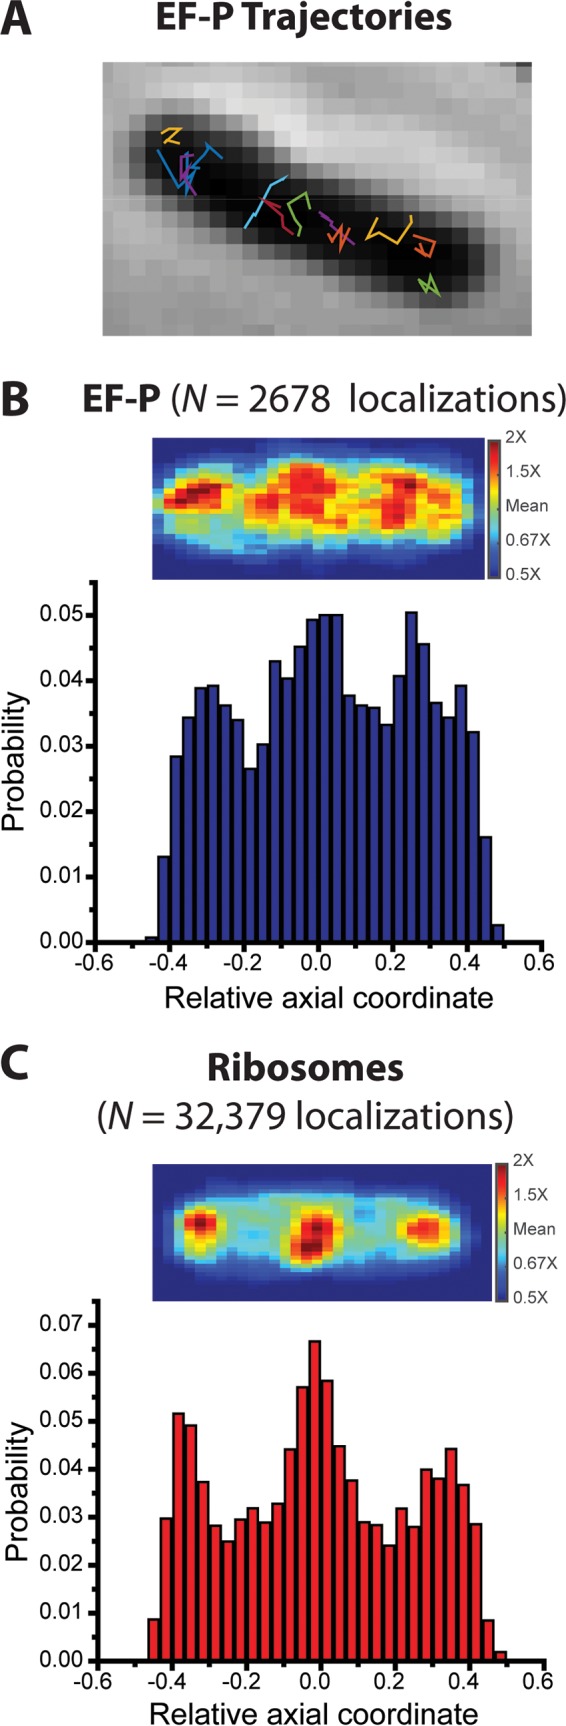
(A) Phase-contrast image of an example cell overlaid with trajectories of single EF-P–mEos2 copies. Imaging at 2 ms/frame. (B) (Top) Localization probability density heat map of 2,678 EF-P–mEos2 copies imaged at 2 ms/frame in different cells of 3.5 to 4.5 µm in length. Each location is placed on a common scale of relative axial position. Only molecules that lasted at least 7 frames contribute to the distribution. (Bottom) Distribution of axial projections on the same relative scale. (C) (Top) Localization probability density map of 32,000 ribosome copies (30S labeled by mEos2). Same imaging conditions as t hose for EF-P–mEos2. (Bottom) Distribution of axial projections on the same relative scale.