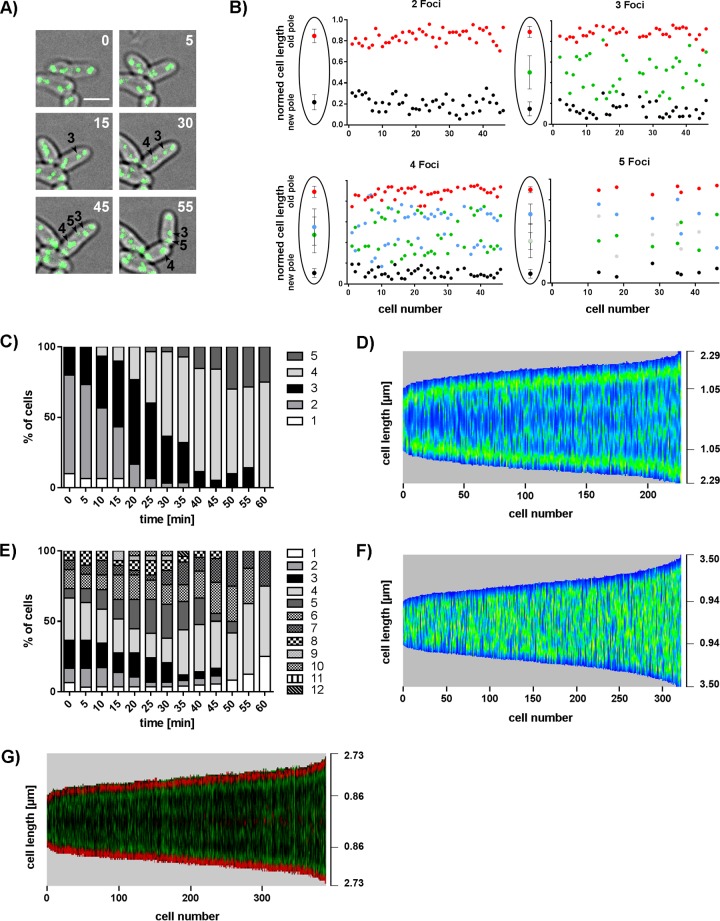
FIG 3 .
oriC localization pattern during cell cycle progression. (A) Occurrence of newly formed ParB-eYFP clusters in the course of cell elongation. Still images show a time series of a typical C. glutamicum WT cell with initially two ParB spots. Three further foci appear over time (arrowheads); time points are indicated in minutes (top right corners). Scale bar, 2 µm. (B) Time-lapse single-cell analyses reveal oriC-ParB complex positions along the long cell axis at each moment in time when a new ParB-eYFP spot occurs. A third, a fourth, and eventually a fifth focus separate from the two initial ParB clusters located close to the cell poles and move toward midcell positions. Cells are aligned with the old pole facing upward; cell lengths are normalized to 1 (n = 46). Schemes shown to the left of the graphs illustrate average ParB-eYFP focus positions ± the standard deviations. (C) Time-dependent increase in the number of ParB clusters per cell. Percentages of cells with one to five spots are depicted for each time point (n = 30). (D) ParB-eYFP pattern along the cell axis depending on cell length in WT C. glutamicum. Automated image analysis of still microscopy images sorted by cell length with high fluorescence intensities displayed in green (n >200). (E) Counts of ParB-eYFP spots over time in C. glutamicum ΔparA. Percentages of cells with 1 to 12 ParB foci were determined for each time point (n = 30). (F) Random ParB-eYFP distribution along the longitudinal cell axis in relation to its length in a ΔparA mutant strain. Automated analysis of still images with high fluorescence intensities displayed in green (n >300). (G) The timing of replication initiation is similar at oriCs of old and young cell poles. Automated image analysis of the C. glutamicum parB::parB-eYFP divIVA::divIVA-mCherry fluorescence pattern sorted by cell length with the old cell pole (high polar DivIVA-mCherry signal level) facing downward. ParB-eYFP (green) and DivIVA-mCherry (red) fluorescence is illustrated in one demograph.

