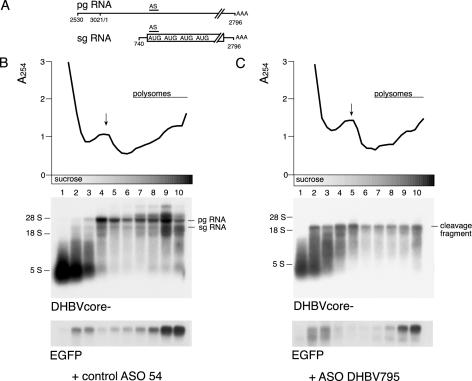
Figure 3.
Stable 3′ mRNA cleavage fragments are associated with polysomes. (A) Schematic diagram of the major transcripts of DHBV. The drawing is not to scale. (B) Polysome analysis of mRNA after cotransfection with control ASO 54 (B) or ASO DHBV795 (C) by sucrose gradient centrifugation. Cytoplasmic extracts were separated on a 10–50% sucrose gradient and fractionated. After fractionation, the absorbance at 254 nm was determined for each of the 30 fractions and is shown at the top of each panel. The position of non-polysomal ribosomal subunits (arrows) and of polysomes is indicated. Fractions from the bottom of the gradient are shown on the right. Three fractions each were pooled and equal volumes of each fraction were loaded for northern-blot analysis using labeled DHBV and EGFP DNA fragments as a probe, respectively. The positions of pgRNA, sgRNA and 3′ cleavage fragments are indicated. The polysomal distribution of EGFP RNA was used as internal control.

