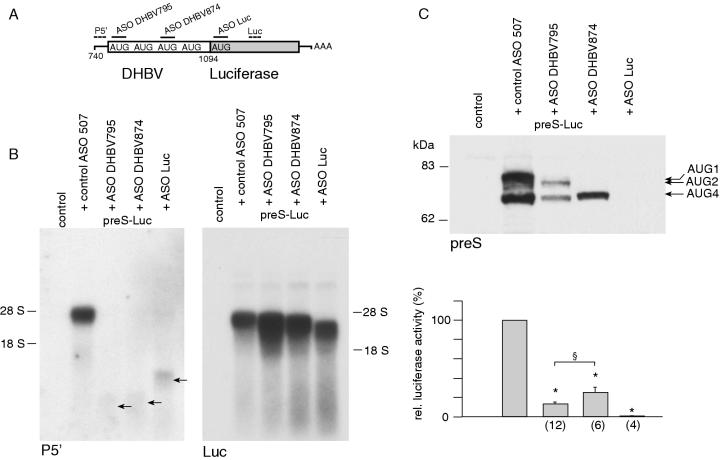
Figure 5.
Stable 3′ mRNA cleavage fragments are translated with moderate efficiency. (A) Translation of stable 3′ mRNA cleavage fragments was quantified using a preS luciferase fusion construct. The binding sites for different ASO and labeled probes are shown. The drawing is not to scale. (B) Northern-blot analysis with probes discriminating RNA cleavage fragments upon cotransfection of preS-Luc with different ASO. Faint bands consistent with 5′ cleavage fragments are indicated by arrows. (C) Immunoblotting of luciferase fusion proteins upon cotransfection with different ASO is depicted (top). Equal amounts of protein were loaded. Quantification of protein yield by luciferase activity (bottom). Values are given in percent compared to luciferase activity obtained after cotransfection of control ASO. The number of observations is given in brackets. Asterisks indicate a statistically significant difference compared with control ASO treated cells, whereas, the section mark symbol indicates a statistically significant difference between cells cotransfected with ASO DHBV795 and DHBV874.

