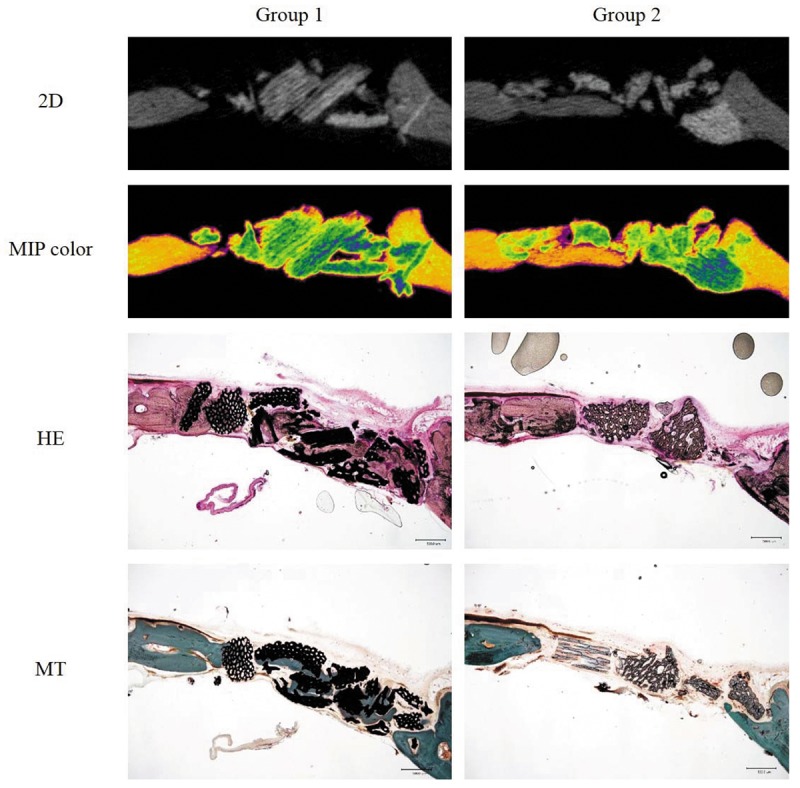
Figure 6. Cross sectional 2D micro-computed tomography (μ-CT) images of new bone formation at 12 weeks after duck-beak bone implantation in criticalsized calvarial bone defect in Sprague Dawley rats. Maximum intensity projection (MIP) images with color mapping help the visualization of new bone mineral density. Typical hematoxylin-eosin (H&E) and Masson’s trichrome (MT) stains of the non-decalcified sections are also presented (×40).

