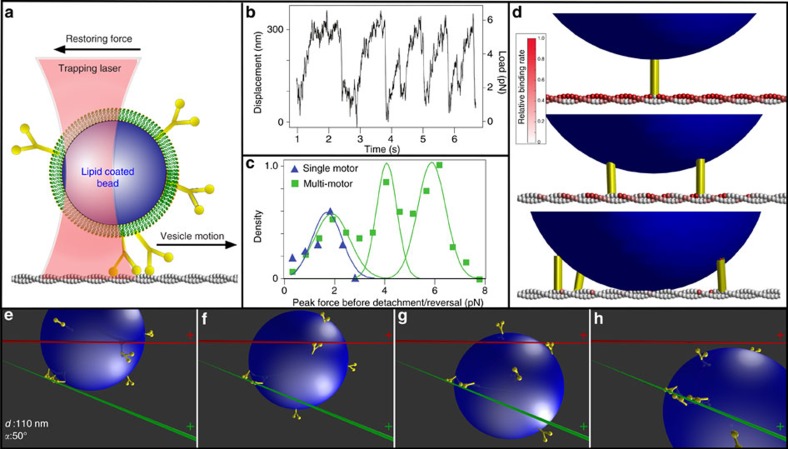
Figure 4. Measurement of motor–cargo complex force production and model simulations.
(a) Schematic of laser trap experiments. (b) Displacement and force trace of motor–cargo complex moving against the restoring force of the laser trap (trap stiffness=0.019±0.004 pN nm−1) (Methods section). Saw tooth pattern arises from motors pulling the cargo until reaching a stall force (that is, plateau) and then detaching only to be repeated multiple times. (c) Histogram of peak force before reversal or detachment for cargo transported by multi-motors (green) and a single motor (blue). (d) Model predicted relative binding rate (red colour bar) for an additional myoVa motor (yellow) to available actin monomers, given 1 (top), 2 (middle) or 3 (bottom) previously bound motors. Relative rate of binding for a new motor decreases with each additionally bound motor. (e–h) Illustration of model result showing how three motors (yellow) transporting lipid-bound cargo (blue) along an actin filament (green) can go straight even when an intersecting filament (red) acts as a physical barrier at the given approach angle (α) and filament separation (d). (f) Single-motor engages intersecting actin, resulting in a tug-of-war between motor ensembles attached to both filaments. (g) Stochastic motor detachment and binding leads to cargo repositioning. (h) With additional repositioning, the intersecting filament no longer acts as a physical barrier, thus allowing the motors to continue straight along the original filament.

