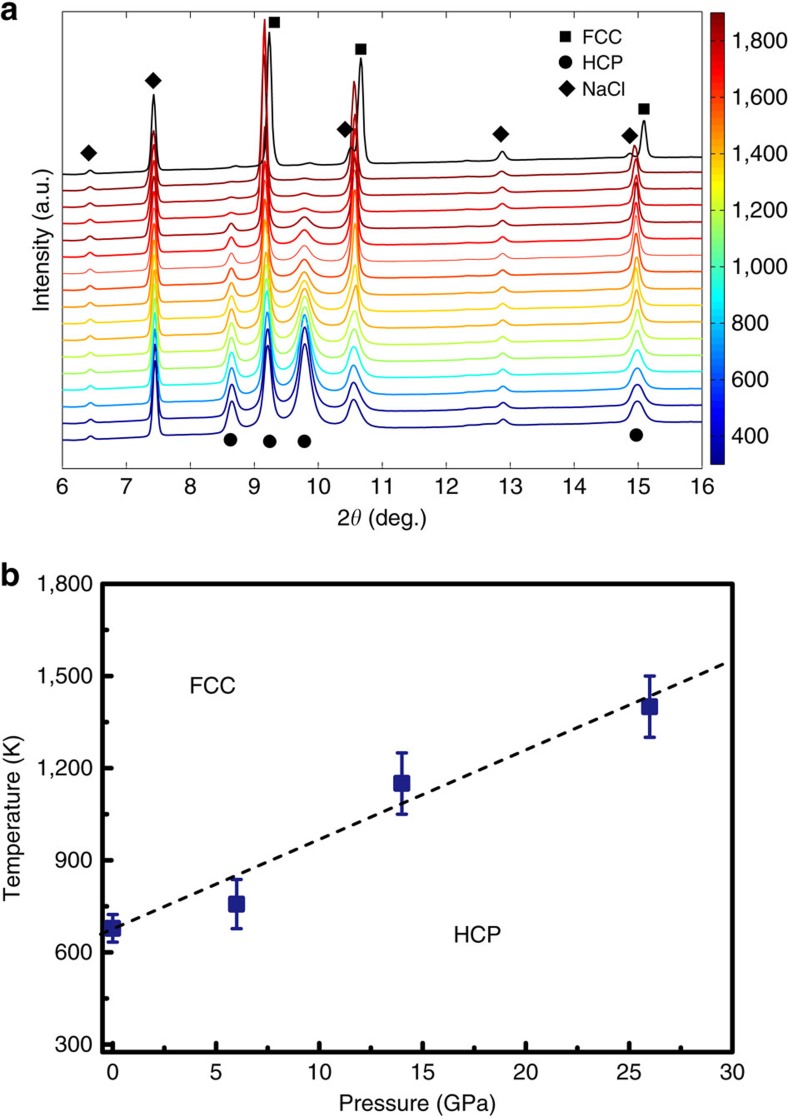
Figure 3. In situ laser heating XRD of the CoCrFeMnNi HEA at different pressures.
(a) The XRD patterns as a function of temperature from room temperature to 1,850 K with an X-ray wavelength of ∼0.3220 Å. The intensity of the major hcp peaks is almost constant below 1,400 K, but starts to gradually decrease during continuous heating above ∼1,400 K, indicating the critical transition temperature occurs at ∼1,400 K. (b) The temperature and pressure metastability boundary (not the equilibrium phase boundary) of the hcp CoCrFeMnNi HEA. The critical transition temperature is determined as the first appearance temperature of the fcc phase from the hcp phase (synthesis curve of the fcc phase) during heating at different pressures and it increases with pressure. The error bars of temperatures were estimated by the fitting errors of the blackbody radiation spectra and the temperature difference between two sides of the sample.

