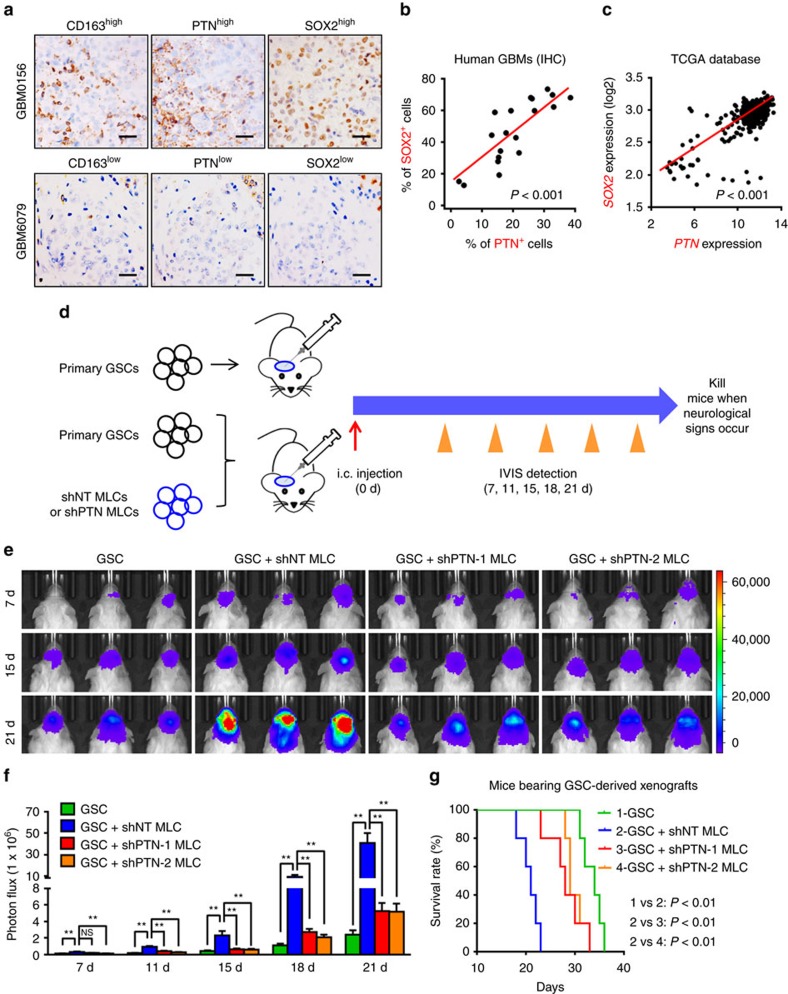
Figure 2. PTN is enriched with GSCs and mediates the pro-tumorigenic effect of M2 TAMs.
(a) IHC staining of M2 TAM marker CD163, PTN and the GSC marker SOX2 in human GBMs using serial sections. Scale bar represents 50 μm. (b,c) Correlation analysis of PTN and SOX2 expressions in GBM specimens from the Southwest hospital (b) and those from the TCGA database (c). P<0.001, Pearson's r test. (d) Schematic diagram of GSC-driven xenografts co-implanted with U937-derived MLCs expressing shPTN (shPTN MLCs) or shNT (shNT MLCs). After implantation, tumour growth was monitored through the IVIS bioluminescent imaging system and mice were killed when neurological signs occurred. (e–f) The representative bioluminescent images (e) and the quantification (f) of the tumour-bearing mice implanted with GSCs only or co-implanted with GSCs and shPTN MLCs or shNT MLCs. Data are shown as means ±s.e.m., n=5, **P<0.01, NS, not significant, ANOVA test. (g) Kaplan–Meier survival curves of mice implanted with GSCs only or co-implanted with GSCs and shPTN MLCs or shNT MLCs. n=5, P<0.01, log-rank test. d, days.

