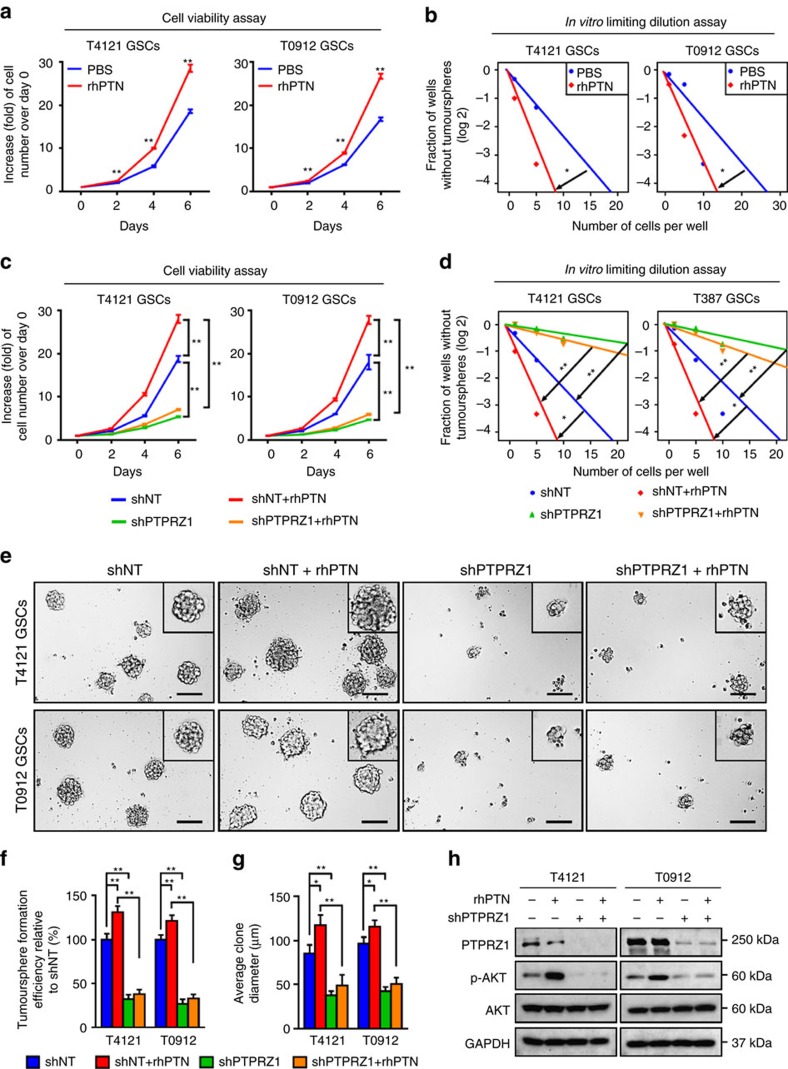
Figure 4. The PTN–PTPRZ1 signalling axis is critical for GSC maintenance.
(a,b) The cell viability assay (a) and in vitro limiting dilution assay (b) of GSCs treated with rhPTN showing that rhPTN facilitated GSC proliferation and self-renewal. Data are shown as means±s.d., n=5, **P<0.01, Student's t-test (a); n=10, *P<0.05, likelihood ratio test (b). (c,d) The cell viability assay (c) and in vitro limiting dilution assay (d) of GSCs expressing shPTPRZ1 or shNT in combination of rhPTN treatment. Disruption of PTPRZ1 compromised the promoting role of PTN on GSC proliferation (c) and self-renewal (d). Data are shown as means±s.d., n=5, **P<0.01, Student's t-test (c); n=10, *P<0.05, **P<0.01, likelihood ratio test (d). (e–g) Tumoursphere formation assay of GSCs expressing shPTPRZ1 or shNT in combination with the treatment of rhPTN. The representative images of GSC tumourspheres (e) and the quantification of numbers (f) and diameter (g) of the GSC tumourspheres showing that silencing PTPRZ1 expression significantly compromises rhPTN-promoted GSC tumoursphere formation ability. Scale bar represents 100 μm. Data are shown as means±s.d., n=5, *P<0.05, **P<0.01, ANOVA test. (h) Immunoblot analyses of PTPRZ1, phospho-AKT (p-Ser473) and total AKT in GSCs expressing shPTPRZ1 or shNT in combination with rhPTN stimulation.

