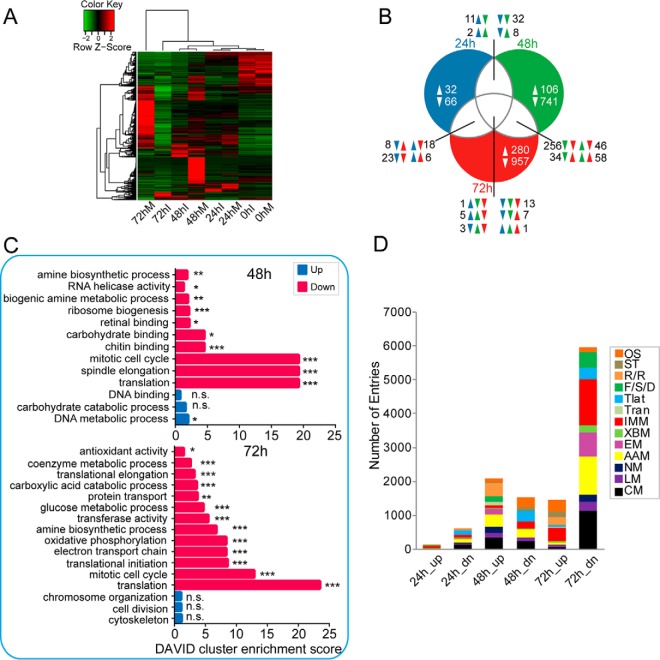
Fig. 2.
Comparison of fat body transcriptomes between control and infected larvae. A, hierarchical clustering analysis of fat body transcripts that were differentially expressed for any comparison between control and infected samples at the four time points. RPKM values for H. armigera transcripts were calculated using RSEM software. Each gene at each time point is shown as a line color-coded according to expression level. Noticeably, most of the genes were significantly down-regulated in the infected group compared with the mock-infected group. B, Venn diagram analysis of commonly and uniquely regulated genes at three time points post-infection (24, 48, and 72 hpi, respectively). The on-line interactive tool Draw Venn Diagram was used to generate a Venn diagram. C, gene ontology enrichment analysis revealed the biological processes and molecular functions most associated with the DEGs. The plots of second-level GO terms corresponding to the up- and down-regulated enriched genes are shown; herein, enrichment analysis was conducted using the functional annotation tool DAVID. Statistical significance was determined at a p value ≤0.05. *, Padj ≤0.05; **, Padj ≤0.01; ***, Padj ≤0.001. The symbol n.s. indicates no significance for the corresponding GO term. D, KEGG functional classification of baculovirus-regulated transcripts. To explore the effect of viral infection on the mRNA abundance of fat body genes, the DEGs induced and repressed upon viral infection were classified functionally. Functional group abbreviations: OS, organismal systems; ST, signal transduction; R/R, replication and repair; F/S/D, folding, sorting and degradation; Tlat, translation; Tran, transcription; IMM, immunity-related; XBM, xenobiotics biodegradation and metabolism; EM, energy metabolism; AAM, amino acid metabolism; NM, nucleotide metabolism; LM, lipid metabolism; CM, carbohydrate metabolism.

