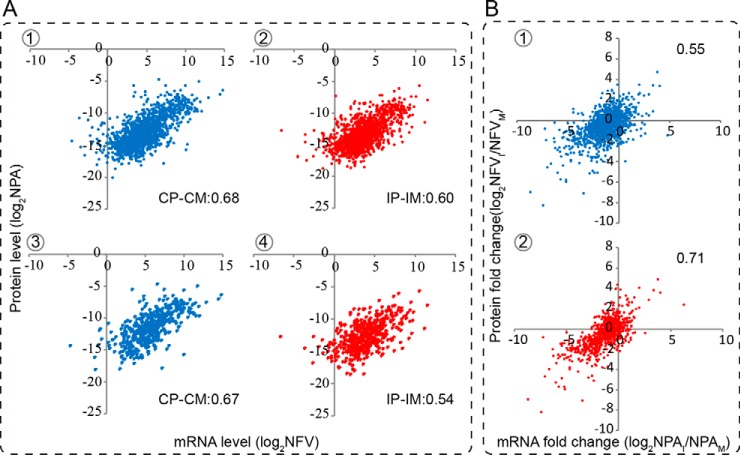
Fig. 6.
Correlation analysis between the mRNA and protein abundances and their changes in the fat body. The normalized peak area of proteins to the normalized RPKM of transcripts in the control and infected groups was plotted in the log2 scale, with the y and x axis indicating the relative protein and mRNA levels, respectively. A, correlations between the mRNA and protein levels in fat body samples in the control and infected groups. The upper panel denotes correlations between the mRNA and protein levels for all of the proteins identified in the fat body, and the lower panel represents correlations for the DEPs. B, correlations of the changes between the mRNA and protein levels. The upper panel represents all of the proteins identified in the fat body, and the lower panel represents the genes that show a similar trend at both mRNA and protein levels.

